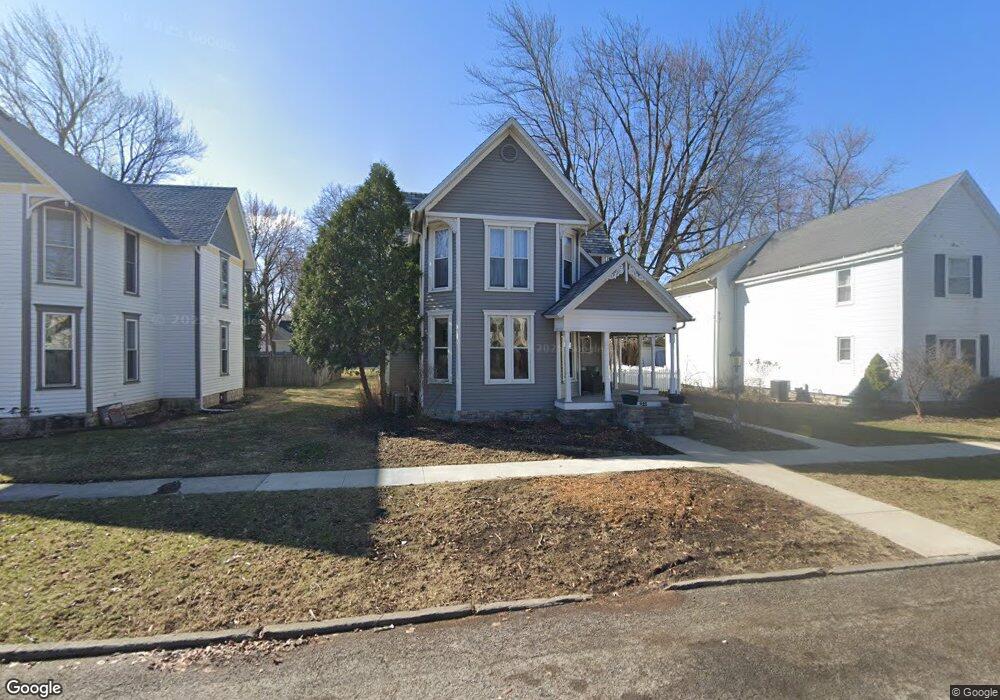
221 3rd St Findlay, OH 45840
Estimated Value: $301,000 - $424,000
4
Beds
3
Baths
3,154
Sq Ft
$112/Sq Ft
Est. Value
About This Home
This home is located at 221 3rd St, Findlay, OH 45840 and is currently estimated at $354,179, approximately $112 per square foot. 221 3rd St is a home located in Hancock County with nearby schools including Jefferson Elementary School, Chamberlin Hill Elementary School, and Donnell Middle School.
Ownership History
Date
Name
Owned For
Owner Type
Purchase Details
Closed on
Mar 1, 2021
Sold by
Joliff Steven
Bought by
Jolliff Wendy
Current Estimated Value
Home Financials for this Owner
Home Financials are based on the most recent Mortgage that was taken out on this home.
Original Mortgage
$219,800
Outstanding Balance
$197,697
Interest Rate
2.9%
Mortgage Type
New Conventional
Estimated Equity
$156,483
Purchase Details
Closed on
Jul 26, 2004
Sold by
Ohler Howard W and Ohler Vickie L
Bought by
Jolliff Steven D and Jolliff Wendy E
Home Financials for this Owner
Home Financials are based on the most recent Mortgage that was taken out on this home.
Original Mortgage
$199,405
Interest Rate
6.4%
Mortgage Type
Purchase Money Mortgage
Purchase Details
Closed on
Aug 19, 1986
Bought by
Ohler Howard W and Ohler Vickie L
Create a Home Valuation Report for This Property
The Home Valuation Report is an in-depth analysis detailing your home's value as well as a comparison with similar homes in the area
Home Values in the Area
Average Home Value in this Area
Purchase History
| Date | Buyer | Sale Price | Title Company |
|---|---|---|---|
| Jolliff Wendy | -- | None Available | |
| Jolliff Steven D | $209,900 | -- | |
| Ohler Howard W | $52,000 | -- |
Source: Public Records
Mortgage History
| Date | Status | Borrower | Loan Amount |
|---|---|---|---|
| Open | Jolliff Wendy | $219,800 | |
| Closed | Jolliff Steven D | $199,405 |
Source: Public Records
Tax History Compared to Growth
Tax History
| Year | Tax Paid | Tax Assessment Tax Assessment Total Assessment is a certain percentage of the fair market value that is determined by local assessors to be the total taxable value of land and additions on the property. | Land | Improvement |
|---|---|---|---|---|
| 2024 | $3,080 | $86,700 | $9,470 | $77,230 |
| 2023 | $3,085 | $86,700 | $9,470 | $77,230 |
| 2022 | $3,074 | $86,700 | $9,470 | $77,230 |
| 2021 | $2,791 | $68,560 | $9,720 | $58,840 |
| 2020 | $2,790 | $68,560 | $9,720 | $58,840 |
| 2019 | $2,734 | $68,560 | $9,720 | $58,840 |
| 2018 | $2,406 | $55,310 | $6,070 | $49,240 |
| 2017 | $1,167 | $55,310 | $6,070 | $49,240 |
| 2016 | $3,680 | $55,310 | $6,070 | $49,240 |
| 2015 | $2,383 | $54,510 | $6,070 | $48,440 |
| 2014 | $2,384 | $54,510 | $6,070 | $48,440 |
| 2012 | $2,402 | $54,510 | $6,070 | $48,440 |
Source: Public Records
Map
Nearby Homes