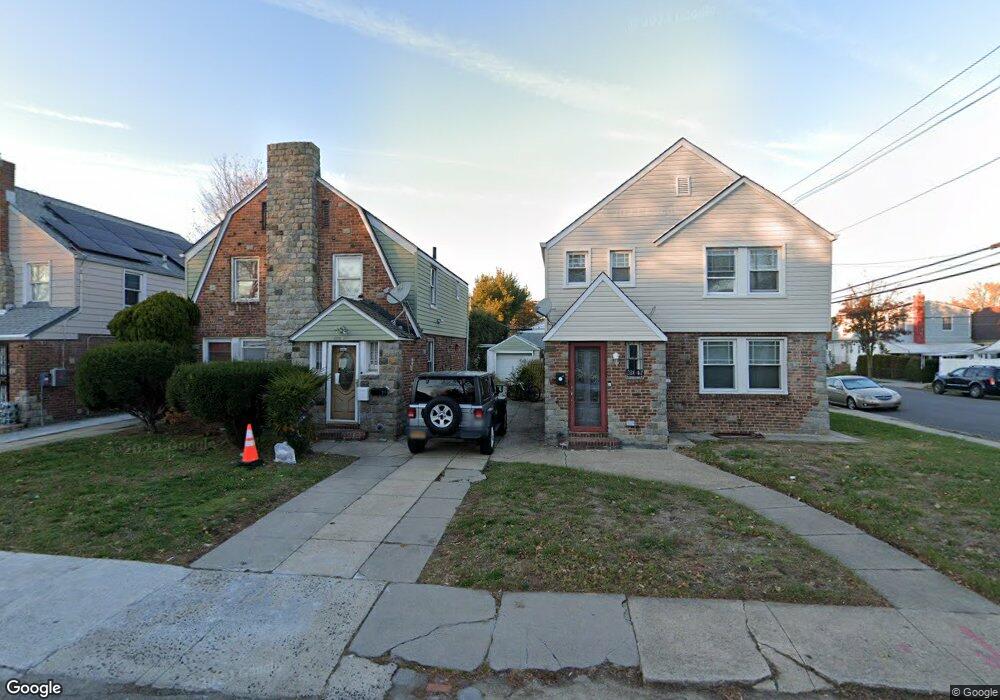
221-43 Murdock Ave Jamaica, NY 11429
Queens Village NeighborhoodEstimated Value: $690,365 - $728,000
3
Beds
2
Baths
1,144
Sq Ft
$622/Sq Ft
Est. Value
About This Home
This home is located at 221-43 Murdock Ave, Jamaica, NY 11429 and is currently estimated at $711,091, approximately $621 per square foot. 221-43 Murdock Ave is a home located in Queens County with nearby schools including P.S./M.S. 147 Ronald Mcnair, I.S. 192 The Linden, and Ss Joachim & Anne School.
Ownership History
Date
Name
Owned For
Owner Type
Purchase Details
Closed on
Dec 19, 2023
Sold by
Metellus Watson
Bought by
221-43 Danisha Corp
Current Estimated Value
Purchase Details
Closed on
Mar 9, 2019
Sold by
Small Moulton D
Bought by
Metellus Watson
Purchase Details
Closed on
Feb 11, 2009
Sold by
Franklin Jaime A and Franklin Jamie A
Bought by
Small Moulton D
Home Financials for this Owner
Home Financials are based on the most recent Mortgage that was taken out on this home.
Original Mortgage
$392,322
Interest Rate
5.06%
Mortgage Type
Purchase Money Mortgage
Purchase Details
Closed on
Sep 26, 1996
Sold by
Cayson Perry
Bought by
Franklin Jamie A and Franklin Joyce M
Home Financials for this Owner
Home Financials are based on the most recent Mortgage that was taken out on this home.
Original Mortgage
$157,158
Interest Rate
7.81%
Mortgage Type
FHA
Create a Home Valuation Report for This Property
The Home Valuation Report is an in-depth analysis detailing your home's value as well as a comparison with similar homes in the area
Home Values in the Area
Average Home Value in this Area
Purchase History
| Date | Buyer | Sale Price | Title Company |
|---|---|---|---|
| 221-43 Danisha Corp | -- | -- | |
| 221-43 Danisha Corp | -- | -- | |
| Metellus Watson | -- | -- | |
| Metellus Watson | -- | -- | |
| Small Moulton D | $397,500 | -- | |
| Small Moulton D | $397,500 | -- | |
| Franklin Jamie A | $160,000 | Chicago Title Insurance Co | |
| Franklin Jamie A | $160,000 | Chicago Title Insurance Co |
Source: Public Records
Mortgage History
| Date | Status | Borrower | Loan Amount |
|---|---|---|---|
| Previous Owner | Small Moulton D | $392,322 | |
| Previous Owner | Franklin Jamie A | $157,158 |
Source: Public Records
Tax History Compared to Growth
Tax History
| Year | Tax Paid | Tax Assessment Tax Assessment Total Assessment is a certain percentage of the fair market value that is determined by local assessors to be the total taxable value of land and additions on the property. | Land | Improvement |
|---|---|---|---|---|
| 2025 | $6,237 | $32,845 | $7,016 | $25,829 |
| 2024 | $6,237 | $31,054 | $7,483 | $23,571 |
| 2023 | $6,145 | $30,594 | $7,660 | $22,934 |
| 2022 | $5,762 | $39,240 | $9,600 | $29,640 |
| 2021 | $6,074 | $32,760 | $9,600 | $23,160 |
| 2020 | $5,794 | $30,960 | $9,600 | $21,360 |
| 2019 | $5,413 | $30,960 | $9,600 | $21,360 |
| 2018 | $5,197 | $25,495 | $7,983 | $17,512 |
| 2017 | $4,903 | $24,052 | $8,533 | $15,519 |
| 2016 | $4,808 | $24,052 | $8,533 | $15,519 |
| 2015 | $2,737 | $22,809 | $10,518 | $12,291 |
| 2014 | $2,737 | $21,565 | $9,944 | $11,621 |
Source: Public Records
Map
Nearby Homes
- 22117 Murdock Ave
- 22324 Murdock Ave
- 22343 113th Dr
- 225-23 Murdock Ave
- 22524 Murdock Ave
- 219-47 112th Ave
- 22533 Murdock Ave
- 112-29 219th St
- 224-06 114th Rd
- 225-53 Murdock Ave
- 22554 Murdock Ave
- 21531 Murdock Ave
- 225-20 111th Ave
- 21739 114th Rd
- 114-36 220th St
- 217-39 114th Rd
- 114-66 225th St
- 22726 112th Rd
- 109-15 221st St
- 22722 112th Ave
- 22143 Murdock Ave
- 22147 Murdock Ave
- 22141 Murdock Ave
- 22137 Murdock Ave
- 22137 Murdock Ave
- 221-42 113th Ave
- 22135 Murdock Ave
- 22146 113th Ave
- 22142 113th Ave
- 221-38 113th Ave
- 22303 Murdock Ave
- 22138 113th Ave
- 221-42 Murdock Ave
- 22131 Murdock Ave
- 22134 113th Ave
- 22140 Murdock Ave
- 22307 Murdock Ave
- 22304 113th Ave
- 223-04 113th Ave
- 22142 Murdock Ave