
Seller's Agent in 2012
Manny Lindo
Highland Real Estate Group
(508) 207-3777
2 in this area
85 Total Sales


Estimated Value: $291,000 - $334,000
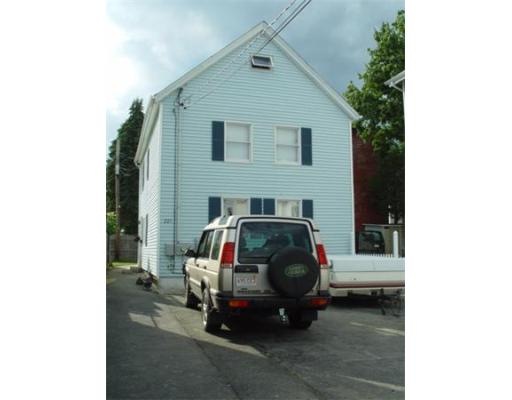
This home is located at 221 4th St, Fall River, MA 02721 since 10 April 2012 and is currently estimated at $303,093, approximately $230 per square foot. This property was built in 1900. 221 4th St is a home located in Bristol County with nearby schools including Henry Lord Community School, B M C Durfee High School, and Saint Stanislaus School.
Last Buyer's Agent
Ken Figuerado
Turbo Sell, Inc.
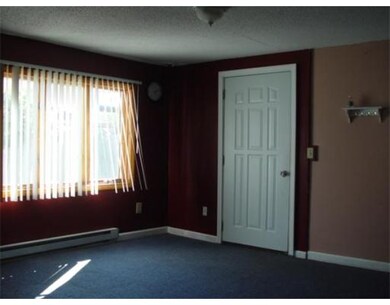
Home Type
Multi-Family
Year Built
1900
Lot Details
2,614 Sq Ft Lot
| Date | Buyer | Sale Price | Title Company |
|---|---|---|---|
| Us Bank Na | $118,900 | -- | |
| Correia Richard | $15,000 | -- | |
| Correia Richard | $45,000 | -- |
| Date | Status | Borrower | Loan Amount |
|---|---|---|---|
| Previous Owner | Correia Richard | $129,600 | |
| Previous Owner | Correia Richard | $84,000 | |
| Previous Owner | Correia Richard | $63,000 |
| Date | Event | Price | List to Sale | Price per Sq Ft |
|---|---|---|---|---|
| 06/29/2012 06/29/12 | Sold | $135,000 | +0.8% | $103 / Sq Ft |
| 05/30/2012 05/30/12 | Pending | -- | -- | -- |
| 04/10/2012 04/10/12 | For Sale | $133,900 | -- | $102 / Sq Ft |
| Year | Tax Paid | Tax Assessment Tax Assessment Total Assessment is a certain percentage of the fair market value that is determined by local assessors to be the total taxable value of land and additions on the property. | Land | Improvement |
|---|---|---|---|---|
| 2025 | $1,414 | $123,500 | $105,200 | $18,300 |
| 2024 | $1,351 | $117,600 | $101,300 | $16,300 |
| 2023 | $1,195 | $97,400 | $83,700 | $13,700 |
| 2022 | $1,159 | $91,800 | $79,700 | $12,100 |
| 2021 | $1,182 | $85,500 | $75,900 | $9,600 |
| 2020 | $1,192 | $82,500 | $74,800 | $7,700 |
| 2019 | $2,187 | $150,000 | $72,000 | $78,000 |
| 2018 | $2,139 | $146,300 | $78,000 | $68,300 |
| 2017 | $1,942 | $138,700 | $74,300 | $64,400 |
| 2016 | $1,933 | $141,800 | $79,100 | $62,700 |
| 2015 | $1,855 | $141,800 | $79,100 | $62,700 |
| 2014 | $1,827 | $145,200 | $76,700 | $68,500 |
Seller's Agent in 2012
Manny Lindo
Highland Real Estate Group
(508) 207-3777
2 in this area
85 Total Sales
K
Buyer's Agent in 2012
Ken Figuerado
Turbo Sell, Inc.
Source: MLS Property Information Network (MLS PIN)
MLS Number: 71364592
APN: FALL-000010I-000000-000058
Disclaimer: Certain information contained herein is derived from information provided by parties other than Homes.com. All information provided is deemed reliable, but is not guaranteed to be accurate and should be independently verified.
![]() The property listing data and information, or the Images, set forth herein were provided to MLS Property Information Network, Inc. from third party sources, including sellers, lessors and public records, and were compiled by MLS Property Information Network, Inc. The property listing data and information, and the Images, are for the personal, non-commercial use of consumers having a good faith interest in purchasing or leasing listed properties of the type displayed to them and may not be used for any purpose other than to identify prospective properties which such consumers may have a good faith interest in purchasing or leasing. MLS Property Information Network, Inc. and its subscribers disclaim any and all representations and warranties as to the accuracy of the property listing data and information, or as to the accuracy of any of the Images, set forth herein.
The property listing data and information, or the Images, set forth herein were provided to MLS Property Information Network, Inc. from third party sources, including sellers, lessors and public records, and were compiled by MLS Property Information Network, Inc. The property listing data and information, and the Images, are for the personal, non-commercial use of consumers having a good faith interest in purchasing or leasing listed properties of the type displayed to them and may not be used for any purpose other than to identify prospective properties which such consumers may have a good faith interest in purchasing or leasing. MLS Property Information Network, Inc. and its subscribers disclaim any and all representations and warranties as to the accuracy of the property listing data and information, or as to the accuracy of any of the Images, set forth herein.
Ask me questions while you tour the home.