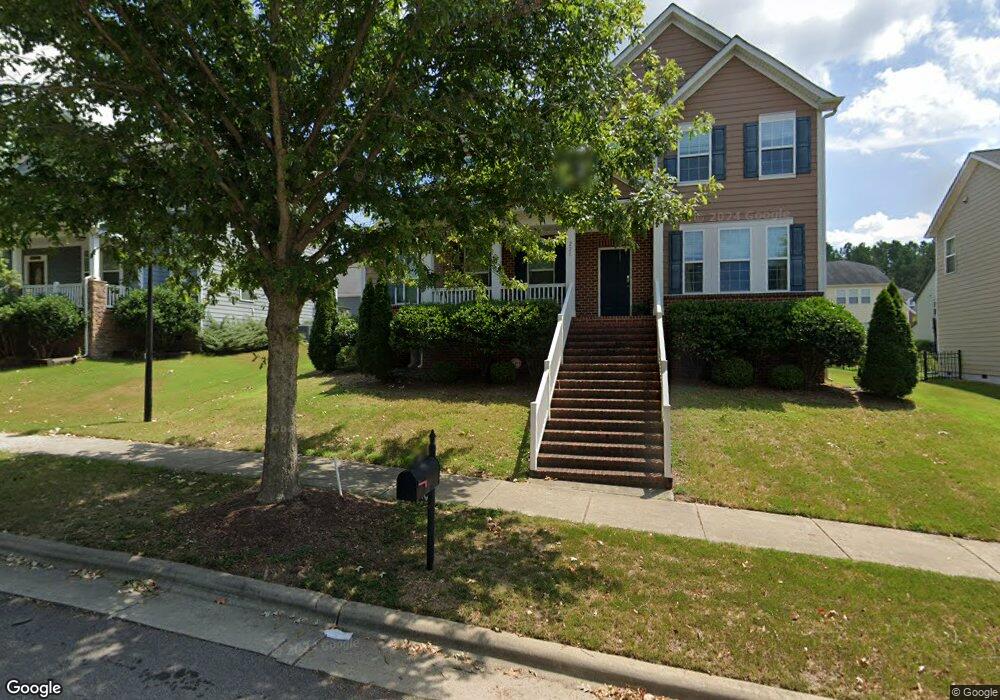
221 Austin View Blvd Unit LO30 Wake Forest, NC 27587
Estimated Value: $488,000 - $594,000
5
Beds
6
Baths
3,227
Sq Ft
$169/Sq Ft
Est. Value
About This Home
This home is located at 221 Austin View Blvd Unit LO30, Wake Forest, NC 27587 and is currently estimated at $546,467, approximately $169 per square foot. 221 Austin View Blvd Unit LO30 is a home located in Wake County with nearby schools including Sanford Creek Elementary School, Wake Forest-Rolesville Middle School, and Wake Forest High School.
Ownership History
Date
Name
Owned For
Owner Type
Purchase Details
Closed on
Jun 24, 2019
Sold by
Gibbs Willis C
Bought by
Karakash John and Karakash Anne
Current Estimated Value
Home Financials for this Owner
Home Financials are based on the most recent Mortgage that was taken out on this home.
Original Mortgage
$227,625
Outstanding Balance
$148,959
Interest Rate
4%
Mortgage Type
New Conventional
Estimated Equity
$397,508
Purchase Details
Closed on
Oct 9, 2018
Sold by
Gibbs Lydia
Bought by
Gibbs Willis C
Purchase Details
Closed on
Jun 20, 2012
Sold by
Beazer Homes Corp
Bought by
Gibbs Willis C and Gibbs Lydia
Home Financials for this Owner
Home Financials are based on the most recent Mortgage that was taken out on this home.
Original Mortgage
$219,286
Interest Rate
3.5%
Mortgage Type
FHA
Create a Home Valuation Report for This Property
The Home Valuation Report is an in-depth analysis detailing your home's value as well as a comparison with similar homes in the area
Home Values in the Area
Average Home Value in this Area
Purchase History
| Date | Buyer | Sale Price | Title Company |
|---|---|---|---|
| Karakash John | $303,500 | None Available | |
| Gibbs Willis C | -- | None Available | |
| Gibbs Willis C | $225,000 | None Available |
Source: Public Records
Mortgage History
| Date | Status | Borrower | Loan Amount |
|---|---|---|---|
| Open | Karakash John | $227,625 | |
| Previous Owner | Gibbs Willis C | $219,286 |
Source: Public Records
Tax History Compared to Growth
Tax History
| Year | Tax Paid | Tax Assessment Tax Assessment Total Assessment is a certain percentage of the fair market value that is determined by local assessors to be the total taxable value of land and additions on the property. | Land | Improvement |
|---|---|---|---|---|
| 2025 | $5,038 | $522,584 | $80,000 | $442,584 |
| 2024 | $5,019 | $522,584 | $80,000 | $442,584 |
| 2023 | $3,739 | $320,052 | $40,000 | $280,052 |
| 2022 | $3,587 | $320,052 | $40,000 | $280,052 |
| 2021 | $3,525 | $320,052 | $40,000 | $280,052 |
| 2020 | $3,525 | $320,052 | $40,000 | $280,052 |
| 2019 | $3,552 | $284,656 | $35,000 | $249,656 |
| 2018 | $3,363 | $284,656 | $35,000 | $249,656 |
| 2017 | $3,251 | $284,656 | $35,000 | $249,656 |
| 2016 | $3,210 | $284,656 | $35,000 | $249,656 |
| 2015 | $3,637 | $318,826 | $36,000 | $282,826 |
| 2014 | $3,521 | $318,826 | $36,000 | $282,826 |
Source: Public Records
Map
Nearby Homes
- 1704 Fawn Chase Ct
- 1824 Longmont Dr
- 1904 Austin Ridge Pkwy
- 417 Austin View Blvd
- 2009 Birdhouse Ln
- 520 Austin View Blvd
- 1816 Birdhouse Ln
- 2236 Longmont Dr
- 1301 Rose Finch Cir
- 333 Trout Valley Rd
- 1728 Fern Hollow Trail
- 276 Kavanaugh Rd
- 1629 Fern Hollow Trail
- HORIZON Plan at Meadow at Jones Dairy
- SHILO Plan at Meadow at Jones Dairy
- ALTON Plan at Meadow at Jones Dairy
- EPIPHANY Plan at Meadow at Jones Dairy
- AURORA Plan at Meadow at Jones Dairy
- MEADOW Plan at Meadow at Jones Dairy
- HAVEN II Plan at Meadow at Jones Dairy
- 221 Austin View Blvd
- 225 Austin View Blvd
- 217 Austin View Blvd
- 229 Austin View Blvd
- 224 Plott Hound Ln
- 213 Austin View Blvd
- 228 Plott Hound Ln
- 220 Plott Hound Ln
- 232 Plott Hound Ln
- 216 Plott Hound Ln
- 220 Austin View Blvd
- 224 Austin View Blvd
- 216 Austin View Blvd
- 233 Austin View Blvd
- 209 Austin View Blvd
- 212 Plott Hound Ln
- 212 Austin View Blvd
- 228 Austin View Blvd
- 300 Plott Hound Ln
- 208 Plott Hound Ln