Estimated Value: $184,000 - $208,000
3
Beds
2
Baths
1,401
Sq Ft
$140/Sq Ft
Est. Value
About This Home
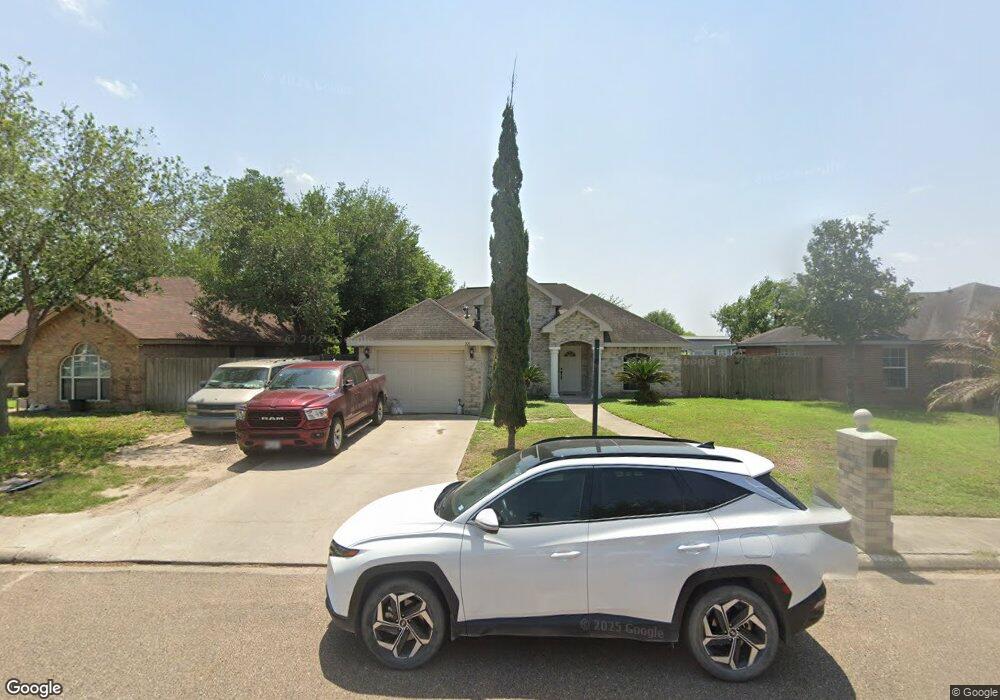
This home is located at 221 Caramel Dr, Alamo, TX 78516 and is currently estimated at $195,539, approximately $139 per square foot. 221 Caramel Dr is a home located in Hidalgo County with nearby schools including Capt. D. Salinas Elementary School, A.P. Solis Middle School, and Donna High School.
Ownership History
Date
Name
Owned For
Owner Type
Purchase Details
Closed on
May 1, 2024
Sold by
Comcor Llc
Bought by
Reyes Abdiel Isai and Reyes Odalys Edith
Current Estimated Value
Home Financials for this Owner
Home Financials are based on the most recent Mortgage that was taken out on this home.
Original Mortgage
$70,000
Interest Rate
6.82%
Mortgage Type
New Conventional
Purchase Details
Closed on
May 23, 2012
Sold by
Saldana Isidro V and Saldana Ester
Bought by
Reyes Martha and Reyes Eliseo
Create a Home Valuation Report for This Property
The Home Valuation Report is an in-depth analysis detailing your home's value as well as a comparison with similar homes in the area
Home Values in the Area
Average Home Value in this Area
Purchase History
| Date | Buyer | Sale Price | Title Company |
|---|---|---|---|
| Reyes Abdiel Isai | -- | None Listed On Document | |
| Reyes Martha | $250,000 | None Available |
Source: Public Records
Mortgage History
| Date | Status | Borrower | Loan Amount |
|---|---|---|---|
| Previous Owner | Reyes Abdiel Isai | $70,000 |
Source: Public Records
Tax History Compared to Growth
Tax History
| Year | Tax Paid | Tax Assessment Tax Assessment Total Assessment is a certain percentage of the fair market value that is determined by local assessors to be the total taxable value of land and additions on the property. | Land | Improvement |
|---|---|---|---|---|
| 2025 | $3,068 | $176,342 | -- | -- |
| 2024 | $3,068 | $160,311 | $30,420 | $129,891 |
| 2023 | $3,900 | $153,234 | $0 | $0 |
| 2022 | $3,481 | $133,618 | $0 | $0 |
| 2021 | $3,187 | $121,471 | $28,860 | $92,611 |
| 2020 | $3,084 | $113,752 | $28,470 | $85,282 |
| 2019 | $2,929 | $106,819 | $28,470 | $78,349 |
| 2018 | $2,935 | $107,733 | $28,470 | $79,263 |
| 2017 | $2,732 | $99,034 | $19,500 | $79,534 |
| 2016 | $2,544 | $92,222 | $17,940 | $74,282 |
| 2015 | $2,210 | $93,067 | $17,940 | $75,127 |
Source: Public Records
Map
Nearby Homes