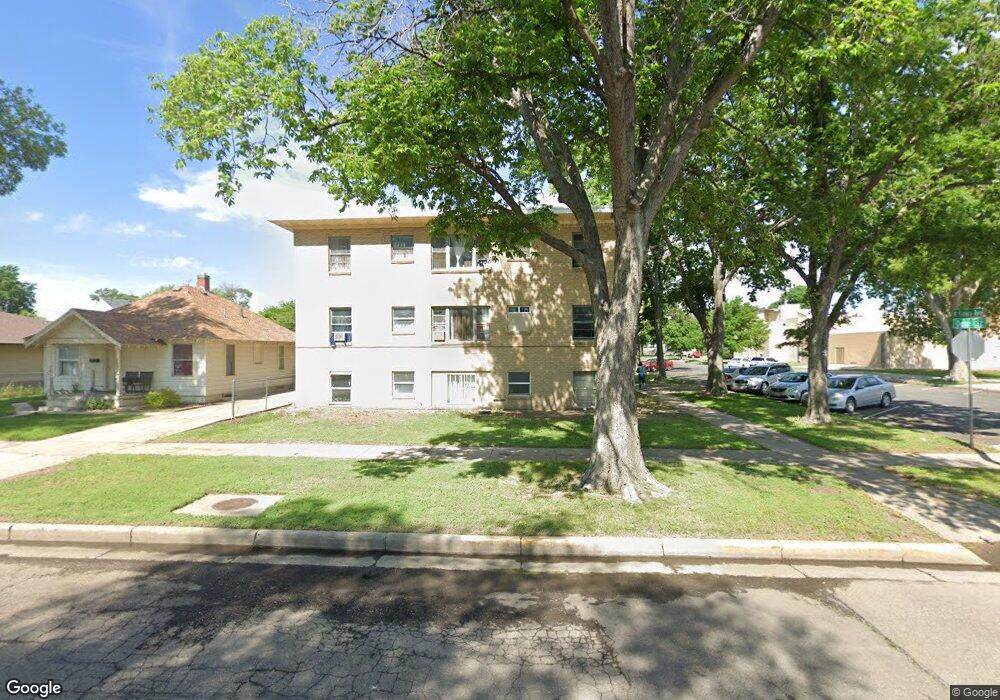
221 Deuel St Fort Morgan, CO 80701
Estimated Value: $201,000 - $247,000
3
Beds
2
Baths
1,388
Sq Ft
$165/Sq Ft
Est. Value
About This Home
This home is located at 221 Deuel St, Fort Morgan, CO 80701 and is currently estimated at $228,630, approximately $164 per square foot. 221 Deuel St is a home located in Morgan County with nearby schools including Fort Morgan High School, Trinity Lutheran School, and Lighthouse Seventh-day Adventist Christian School.
Ownership History
Date
Name
Owned For
Owner Type
Purchase Details
Closed on
Jun 15, 2006
Sold by
Staley John M and Staley Robert D
Bought by
Ballgame Properties Llc
Current Estimated Value
Purchase Details
Closed on
Apr 14, 2006
Sold by
The Secretary Of Hud
Bought by
Staley John M and Staley Robert D
Purchase Details
Closed on
Aug 4, 2005
Sold by
Colrado Housing And Finance Authority
Bought by
Colardo Hosing and Colardo Faince
Purchase Details
Closed on
May 25, 2005
Sold by
Colorado Housing & Finance Authority
Bought by
Secretary Of Housing & Urban Development
Create a Home Valuation Report for This Property
The Home Valuation Report is an in-depth analysis detailing your home's value as well as a comparison with similar homes in the area
Home Values in the Area
Average Home Value in this Area
Purchase History
| Date | Buyer | Sale Price | Title Company |
|---|---|---|---|
| Ballgame Properties Llc | -- | None Available | |
| Staley John M | -- | None Available | |
| Colardo Hosing | -- | None Available | |
| Secretary Of Housing & Urban Development | -- | None Available |
Source: Public Records
Tax History Compared to Growth
Tax History
| Year | Tax Paid | Tax Assessment Tax Assessment Total Assessment is a certain percentage of the fair market value that is determined by local assessors to be the total taxable value of land and additions on the property. | Land | Improvement |
|---|---|---|---|---|
| 2024 | $697 | $8,700 | $2,090 | $6,610 |
| 2023 | $697 | $12,380 | $2,980 | $9,400 |
| 2022 | $717 | $8,750 | $2,920 | $5,830 |
| 2021 | $738 | $8,990 | $3,000 | $5,990 |
| 2020 | $696 | $8,260 | $2,860 | $5,400 |
| 2019 | $698 | $8,260 | $2,860 | $5,400 |
| 2018 | $529 | $6,170 | $2,300 | $3,870 |
| 2017 | $529 | $6,170 | $2,300 | $3,870 |
| 2016 | $489 | $5,650 | $1,990 | $3,660 |
| 2015 | $482 | $5,650 | $1,990 | $3,660 |
| 2014 | $459 | $5,240 | $1,590 | $3,650 |
| 2013 | -- | $5,240 | $1,590 | $3,650 |
Source: Public Records
Map
Nearby Homes