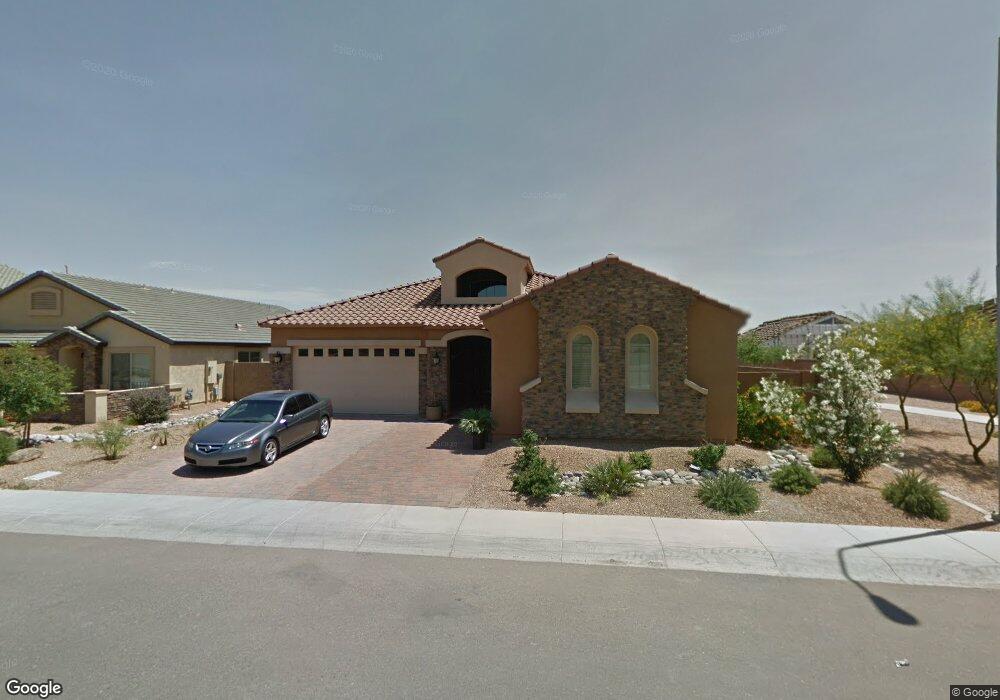
221 E Havasu Place Chandler, AZ 85249
Ocotillo NeighborhoodEstimated Value: $745,967 - $809,000
--
Bed
--
Bath
2,786
Sq Ft
$282/Sq Ft
Est. Value
About This Home
This home is located at 221 E Havasu Place, Chandler, AZ 85249 and is currently estimated at $786,992, approximately $282 per square foot. 221 E Havasu Place is a home with nearby schools including Fulton Elementary School, Hamilton High School, and Santan Junior High School.
Ownership History
Date
Name
Owned For
Owner Type
Purchase Details
Closed on
Sep 9, 2021
Sold by
Jepaliya Aniket S
Bought by
Jepaliya Aniket S and Jepaliya Aashaka
Current Estimated Value
Home Financials for this Owner
Home Financials are based on the most recent Mortgage that was taken out on this home.
Original Mortgage
$450,000
Outstanding Balance
$409,467
Interest Rate
2.8%
Mortgage Type
New Conventional
Estimated Equity
$377,525
Purchase Details
Closed on
Oct 24, 2014
Sold by
Jepaliya Aashaka A
Bought by
Jepaliya Aniket S
Home Financials for this Owner
Home Financials are based on the most recent Mortgage that was taken out on this home.
Original Mortgage
$350,770
Interest Rate
2.62%
Mortgage Type
Adjustable Rate Mortgage/ARM
Purchase Details
Closed on
Oct 20, 2014
Sold by
D R Horton Inc
Bought by
Jepaliya Aniket S
Home Financials for this Owner
Home Financials are based on the most recent Mortgage that was taken out on this home.
Original Mortgage
$350,770
Interest Rate
2.62%
Mortgage Type
Adjustable Rate Mortgage/ARM
Create a Home Valuation Report for This Property
The Home Valuation Report is an in-depth analysis detailing your home's value as well as a comparison with similar homes in the area
Home Values in the Area
Average Home Value in this Area
Purchase History
| Date | Buyer | Sale Price | Title Company |
|---|---|---|---|
| Jepaliya Aniket S | -- | Wfg National Title Ins Co | |
| Jepaliya Aniket S | -- | Dhi Title Agency | |
| Jepaliya Aniket S | $389,745 | Dhi Title Agency |
Source: Public Records
Mortgage History
| Date | Status | Borrower | Loan Amount |
|---|---|---|---|
| Open | Jepaliya Aniket S | $450,000 | |
| Closed | Jepaliya Aniket S | $350,770 | |
| Closed | Jepaliya Aniket S | $350,770 |
Source: Public Records
Tax History Compared to Growth
Tax History
| Year | Tax Paid | Tax Assessment Tax Assessment Total Assessment is a certain percentage of the fair market value that is determined by local assessors to be the total taxable value of land and additions on the property. | Land | Improvement |
|---|---|---|---|---|
| 2025 | $3,073 | $39,285 | -- | -- |
| 2024 | $2,956 | $37,415 | -- | -- |
| 2023 | $2,956 | $56,570 | $11,310 | $45,260 |
| 2022 | $2,852 | $43,670 | $8,730 | $34,940 |
| 2021 | $2,989 | $41,510 | $8,300 | $33,210 |
| 2020 | $2,976 | $38,980 | $7,790 | $31,190 |
| 2019 | $2,862 | $36,210 | $7,240 | $28,970 |
| 2018 | $2,771 | $34,110 | $6,820 | $27,290 |
| 2017 | $2,583 | $32,130 | $6,420 | $25,710 |
| 2016 | $2,489 | $33,810 | $6,760 | $27,050 |
| 2015 | $2,411 | $30,920 | $6,180 | $24,740 |
Source: Public Records
Map
Nearby Homes
- 411 E Crescent Place
- 492 E Rainbow Dr
- 4303 S Oregon Ct
- 5070 S California St
- 5185 S Eileen Dr
- 715 E Kaibab Dr
- 789 E San Carlos Way
- 191 W Beechnut Place
- 4086 S Springs Dr
- 4046 S Springs Dr
- 4056 S Springs Dr
- 4196 S Springs Dr
- 4076 S Springs Dr
- 4186 S Springs Dr
- 4106 S Springs Dr
- 4096 S Springs Dr
- 4066 S Springs Dr
- 1070 E Yellowstone Place
- 773 E Glacier Dr
- 577 W Horseshoe Place
- 231 E Havasu Place
- 201 E Havasu Place
- 241 E Havasu Place
- 222 E Crescent Place
- 232 E Crescent Place
- 191 E Havasu Place
- 220 E Havasu Place
- 210 E Havasu Place
- 202 E Crescent Place
- 230 E Havasu Place
- 200 E Havasu Place
- 242 E Crescent Place
- 190 E Havasu Place
- 251 E Havasu Place
- 192 E Crescent Place
- 240 E Havasu Place
- 181 E Havasu Place
- 252 E Crescent Place
- 182 E Crescent Place
- 261 E Havasu Place