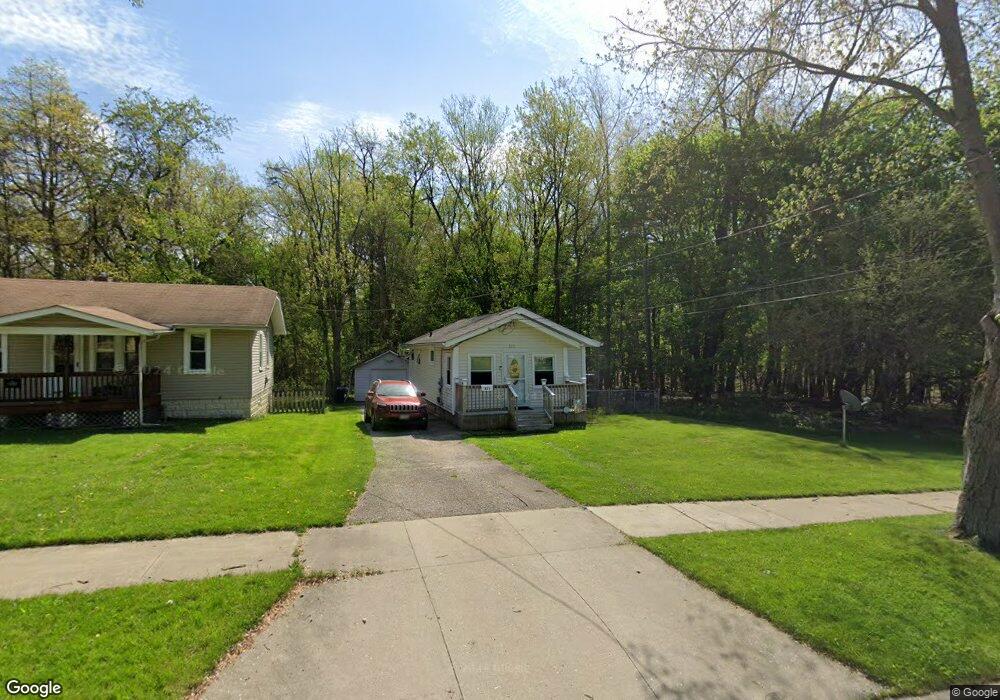
221 E Park Blvd Akron, OH 44305
Goodyear Heights NeighborhoodEstimated Value: $75,000 - $94,865
2
Beds
1
Bath
600
Sq Ft
$142/Sq Ft
Est. Value
About This Home
This home is located at 221 E Park Blvd, Akron, OH 44305 and is currently estimated at $85,216, approximately $142 per square foot. 221 E Park Blvd is a home located in Summit County with nearby schools including Ellet High School, Middlebury Academy, and Akron Preparatory school.
Ownership History
Date
Name
Owned For
Owner Type
Purchase Details
Closed on
May 2, 2025
Sold by
Harbarger Lee P and Harbarger Beverly A
Bought by
Brophy Joshua and Brophy Heather
Current Estimated Value
Home Financials for this Owner
Home Financials are based on the most recent Mortgage that was taken out on this home.
Original Mortgage
$65,600
Outstanding Balance
$65,369
Interest Rate
6.67%
Mortgage Type
New Conventional
Estimated Equity
$19,847
Purchase Details
Closed on
Sep 12, 2008
Sold by
Fannie Mae
Bought by
Harbarger Lee P
Purchase Details
Closed on
Apr 17, 2008
Sold by
Wright Judith A
Bought by
Federal National Mortgage Association
Purchase Details
Closed on
Feb 19, 2001
Sold by
Houska Michael J
Bought by
Wright Judith A
Home Financials for this Owner
Home Financials are based on the most recent Mortgage that was taken out on this home.
Original Mortgage
$54,400
Interest Rate
7.02%
Purchase Details
Closed on
Aug 25, 2000
Sold by
Hackett Gregory F
Bought by
Houska Michael J
Create a Home Valuation Report for This Property
The Home Valuation Report is an in-depth analysis detailing your home's value as well as a comparison with similar homes in the area
Home Values in the Area
Average Home Value in this Area
Purchase History
| Date | Buyer | Sale Price | Title Company |
|---|---|---|---|
| Brophy Joshua | $82,000 | None Listed On Document | |
| Harbarger Lee P | $19,250 | Accutitle Agency Inc | |
| Federal National Mortgage Association | $40,000 | None Available | |
| Wright Judith A | $68,000 | Approved Statewide Title Age | |
| Houska Michael J | $34,500 | Tri County Title |
Source: Public Records
Mortgage History
| Date | Status | Borrower | Loan Amount |
|---|---|---|---|
| Open | Brophy Joshua | $65,600 | |
| Previous Owner | Wright Judith A | $54,400 | |
| Closed | Wright Judith A | $10,200 |
Source: Public Records
Tax History Compared to Growth
Tax History
| Year | Tax Paid | Tax Assessment Tax Assessment Total Assessment is a certain percentage of the fair market value that is determined by local assessors to be the total taxable value of land and additions on the property. | Land | Improvement |
|---|---|---|---|---|
| 2025 | $1,563 | $28,211 | $9,223 | $18,988 |
| 2024 | $1,563 | $28,211 | $9,223 | $18,988 |
| 2023 | $1,563 | $28,211 | $9,223 | $18,988 |
| 2022 | $1,517 | $18,718 | $5,950 | $12,768 |
| 2021 | $1,518 | $18,718 | $5,950 | $12,768 |
| 2020 | $1,499 | $18,720 | $5,950 | $12,770 |
| 2019 | $1,517 | $17,250 | $5,770 | $11,480 |
| 2018 | $1,500 | $17,250 | $5,770 | $11,480 |
| 2017 | $1,520 | $17,250 | $5,770 | $11,480 |
| 2016 | $1,521 | $17,250 | $5,770 | $11,480 |
| 2015 | $1,520 | $17,250 | $5,770 | $11,480 |
| 2014 | $1,510 | $17,250 | $5,770 | $11,480 |
| 2013 | $1,690 | $20,180 | $5,770 | $14,410 |
Source: Public Records
Map
Nearby Homes
- 287 E Park Blvd
- 360 Cluster Ave
- 404 Newell Ave
- 249 Malacca St
- 248 Malacca St
- 1892 Malasia Rd
- 428 Seaman Ave
- 499 Tompkins Ave
- 522 Lamont St
- 1947 Preston Ave Unit 1949
- 2258 Mogadore Rd
- 2216 Eastlawn Ave
- 1796 Newton St
- 57 Carlton Dr
- 580 Elko Ave
- 2382 Mogadore Rd
- 486 Frazier Ave
- 1874 Adelaide Blvd
- 466 the Brooklands
- 1837 Marks Ave
- 229 E Park Blvd
- 233 E Park Blvd
- 358 Sullivan Ave
- 239 E Park Blvd
- 222 E Park Blvd
- 218 E Park Blvd
- 226 E Park Blvd
- 364 Sullivan Ave
- 230 E Park Blvd
- 210 E Park Blvd
- 243 E Park Blvd
- 234 E Park Blvd
- 368 Sullivan Ave
- 238 E Park Blvd
- 357 Sullivan Ave
- 249 E Park Blvd
- 1971 Genoa Ave
- 242 E Park Blvd
- 370 Sullivan Ave
- 363 Sullivan Ave