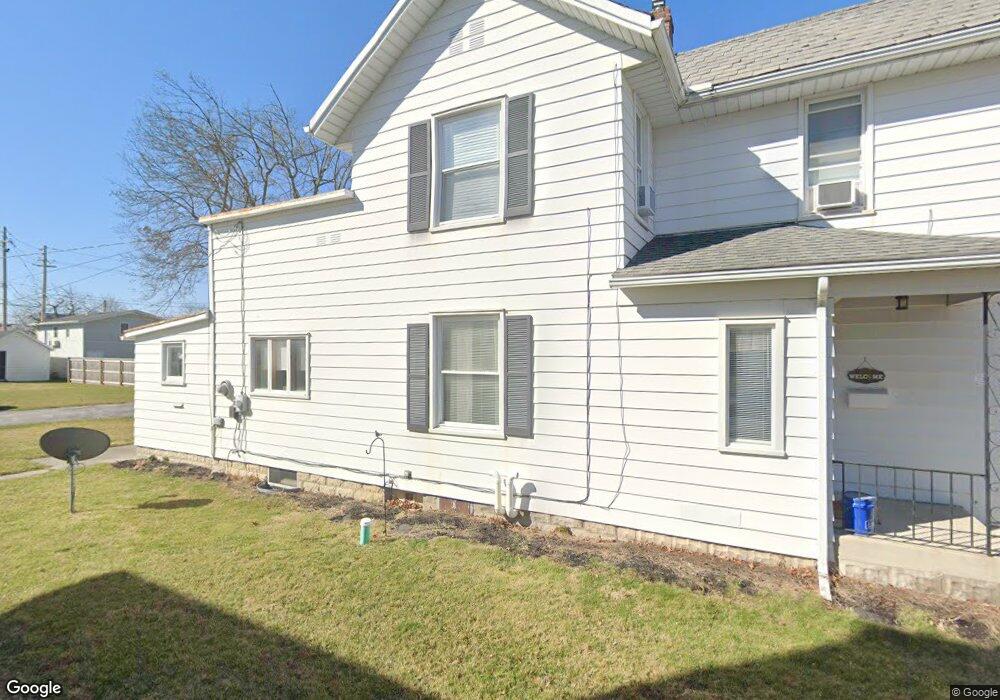
221 Elm St Findlay, OH 45840
Estimated Value: $187,000 - $210,820
3
Beds
2
Baths
1,610
Sq Ft
$125/Sq Ft
Est. Value
About This Home
This home is located at 221 Elm St, Findlay, OH 45840 and is currently estimated at $201,955, approximately $125 per square foot. 221 Elm St is a home located in Hancock County with nearby schools including Lincoln Elementary School, Donnell Middle School, and Findlay High School.
Ownership History
Date
Name
Owned For
Owner Type
Purchase Details
Closed on
Sep 7, 2018
Sold by
Tomle Karen L and The Marjorie K Freemyer Trust
Bought by
Goergens Glen J and Goergens Heather M
Current Estimated Value
Home Financials for this Owner
Home Financials are based on the most recent Mortgage that was taken out on this home.
Original Mortgage
$109,971
Outstanding Balance
$95,951
Interest Rate
4.62%
Mortgage Type
FHA
Estimated Equity
$106,004
Purchase Details
Closed on
Jan 10, 2005
Sold by
Estate Of Marjorie K Freemyer
Bought by
Moats James R and Marjorie K Freemyer Trust
Purchase Details
Closed on
Aug 26, 1994
Sold by
Mcgrain Edward
Bought by
Neal Thomas and Neal Jill
Home Financials for this Owner
Home Financials are based on the most recent Mortgage that was taken out on this home.
Original Mortgage
$52,000
Interest Rate
8.72%
Mortgage Type
New Conventional
Create a Home Valuation Report for This Property
The Home Valuation Report is an in-depth analysis detailing your home's value as well as a comparison with similar homes in the area
Home Values in the Area
Average Home Value in this Area
Purchase History
| Date | Buyer | Sale Price | Title Company |
|---|---|---|---|
| Goergens Glen J | $112,000 | Flag City Title Agency | |
| Moats James R | -- | -- | |
| Neal Thomas | $67,000 | -- |
Source: Public Records
Mortgage History
| Date | Status | Borrower | Loan Amount |
|---|---|---|---|
| Open | Goergens Glen J | $109,971 | |
| Previous Owner | Neal Thomas | $52,000 |
Source: Public Records
Tax History Compared to Growth
Tax History
| Year | Tax Paid | Tax Assessment Tax Assessment Total Assessment is a certain percentage of the fair market value that is determined by local assessors to be the total taxable value of land and additions on the property. | Land | Improvement |
|---|---|---|---|---|
| 2024 | $1,777 | $50,010 | $7,670 | $42,340 |
| 2023 | $1,779 | $50,010 | $7,670 | $42,340 |
| 2022 | $1,773 | $50,010 | $7,670 | $42,340 |
| 2021 | $1,711 | $42,030 | $7,850 | $34,180 |
| 2020 | $1,711 | $42,030 | $7,850 | $34,180 |
| 2019 | $1,676 | $42,030 | $7,850 | $34,180 |
| 2018 | $1,558 | $35,800 | $5,530 | $30,270 |
| 2017 | $1,598 | $35,800 | $5,530 | $30,270 |
| 2016 | $1,583 | $35,800 | $5,530 | $30,270 |
| 2015 | $1,100 | $24,450 | $5,530 | $18,920 |
| 2014 | $1,100 | $24,450 | $5,530 | $18,920 |
| 2012 | $999 | $21,990 | $5,530 | $16,460 |
Source: Public Records
Map
Nearby Homes