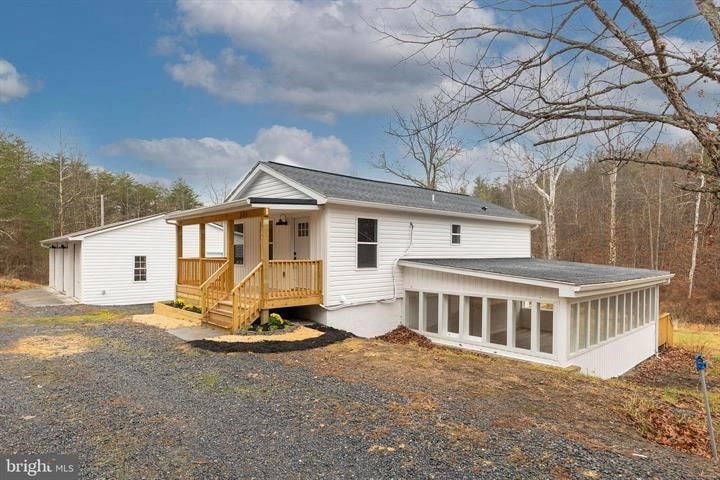


221 Heavenly Ln Capon Bridge, WV 26711
Estimated payment $1,806/month
About This Home
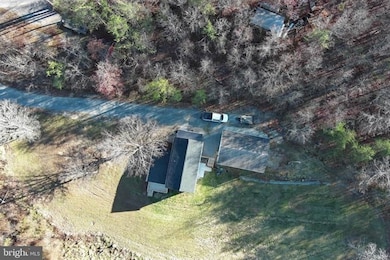
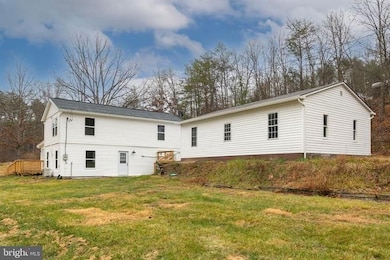
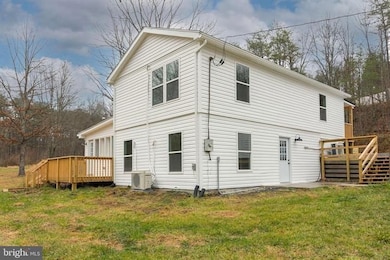
Beautifully Remodeled Modern Home on 2 Private Acres! Completely renovated inside and out with modern finishes and quality craftsmanship, this stunning home sits on an unrestricted 2-acre parcel at the end of a peaceful lane. Enjoy a large, level yard bordered by a charming wet-weather stream, along with a huge 3-car detached garage offering exceptional storage or workshop space. Don't let the exterior size fool you. This home offers a surprising amount of living space at over 1500 finished sq/ft. Additional finished square footage is provided by a spacious 1626 sun porch, perfect for year-round enjoyment. Located just 30 minutes from Winchester, VA, this property offers the ideal balance of convenience and quiet country living.

Home Details
Home Type
- Single Family
Bedrooms and Bathrooms
- 3 Bedrooms
Map
Home Values in the Area
Average Home Value in this Area
Tax History
| Year | Tax Paid | Tax Assessment Tax Assessment Total Assessment is a certain percentage of the fair market value that is determined by local assessors to be the total taxable value of land and additions on the property. | Land | Improvement |
|---|---|---|---|---|
| 2025 | $588 | $69,360 | $31,140 | $38,220 |
| 2024 | $559 | $64,320 | $28,320 | $36,000 |
| 2023 | $544 | $62,400 | $26,400 | $36,000 |
| 2022 | $554 | $63,360 | $24,420 | $38,940 |
| 2021 | $568 | $63,480 | $24,420 | $39,060 |
| 2020 | $450 | $63,480 | $24,420 | $39,060 |
| 2019 | $449 | $62,220 | $23,460 | $38,760 |
| 2018 | $452 | $62,640 | $23,460 | $39,180 |
| 2017 | $439 | $60,840 | $24,420 | $36,420 |
| 2016 | $880 | $61,740 | $24,420 | $37,320 |
| 2015 | $885 | $62,520 | $23,460 | $39,060 |
| 2014 | -- | $62,580 | $23,460 | $39,120 |
Property History
| Date | Event | Price | List to Sale | Price per Sq Ft | Prior Sale |
|---|---|---|---|---|---|
| 11/26/2025 11/26/25 | For Sale | $335,000 | +148.1% | $220 / Sq Ft | |
| 04/14/2025 04/14/25 | Sold | $135,000 | -25.0% | $89 / Sq Ft | View Prior Sale |
| 03/17/2025 03/17/25 | Pending | -- | -- | -- | |
| 03/08/2025 03/08/25 | For Sale | $180,000 | +56.5% | $118 / Sq Ft | |
| 04/12/2019 04/12/19 | Sold | $115,000 | 0.0% | $151 / Sq Ft | View Prior Sale |
| 03/26/2019 03/26/19 | For Sale | $115,000 | 0.0% | $151 / Sq Ft | |
| 03/19/2019 03/19/19 | Off Market | $115,000 | -- | -- | |
| 11/25/2018 11/25/18 | Price Changed | $115,000 | -4.2% | $151 / Sq Ft | |
| 10/15/2018 10/15/18 | Price Changed | $120,000 | -7.7% | $158 / Sq Ft | |
| 09/19/2018 09/19/18 | For Sale | $130,000 | +44.6% | $171 / Sq Ft | |
| 08/06/2015 08/06/15 | Sold | $89,900 | 0.0% | -- | View Prior Sale |
| 05/29/2015 05/29/15 | Pending | -- | -- | -- | |
| 05/27/2015 05/27/15 | For Sale | $89,900 | +69.6% | -- | |
| 12/05/2014 12/05/14 | Sold | $53,000 | -3.5% | $0 / Sq Ft | View Prior Sale |
| 11/06/2014 11/06/14 | Pending | -- | -- | -- | |
| 11/03/2014 11/03/14 | For Sale | $54,900 | 0.0% | $0 / Sq Ft | |
| 10/02/2014 10/02/14 | Pending | -- | -- | -- | |
| 09/24/2014 09/24/14 | Price Changed | $54,900 | -15.4% | $0 / Sq Ft | |
| 09/23/2014 09/23/14 | For Sale | $64,900 | 0.0% | $0 / Sq Ft | |
| 08/12/2014 08/12/14 | Pending | -- | -- | -- | |
| 07/29/2014 07/29/14 | Price Changed | $64,900 | -18.8% | $0 / Sq Ft | |
| 07/02/2014 07/02/14 | For Sale | $79,900 | -- | $0 / Sq Ft |
- 188 Oak Dr
- 96 Alkire Ct
- 0 40 955 Ac Intersection Rt 50 & Smokey Hollow Rd Unit WVHS2006686
- TBD Hummingbird Ln
- 420 Twine Ln
- 3949 Cold Stream Rd
- 15 Scenic Dr
- 0 5 6 Cooper Mountain View
- 68 Scenic Dr
- 110 Welbourne Ln
- 0 3 Oaks Dr Unit VAFV2037858
- 699 Hoover Young Dr
- 100 Bubbling Spring Rd
- 3815 Capon River Rd
- 902 Carpers Pike
- 155 Blackberry Ln
- Lot G Mayflower Dr
- 212 Whitacre Rd
- 164 Pasture Ln
- 6 Cooper Mountain View Dr
- 1561 Carpers Pike
- 1909 Back Mountain Rd
- 239 McDonald Rd
- 709 Dicks Hollow Rd
- 1608 Laurel Grove Rd
- 1608 Laurel Grove Rd
- 1042 Laurel Grove Rd Unit Luxury Apartment for rent
- 424 Ridgewood Ln
- 226 Allison Ave
- 1310 Ramseur Ln
- 104 Reign Way
- 290 Sage Cir
- 109 Lance Way
- 1958 Cidermill Ln
- 1970 Cidermill Ln
- 1950 Melvor Ln
- 2047 Harvest Dr
- 5452 Middle Rd
- 1815 Reese
- 660 Pemberton Dr