Estimated Value: $285,000 - $324,000
3
Beds
2
Baths
1,529
Sq Ft
$196/Sq Ft
Est. Value
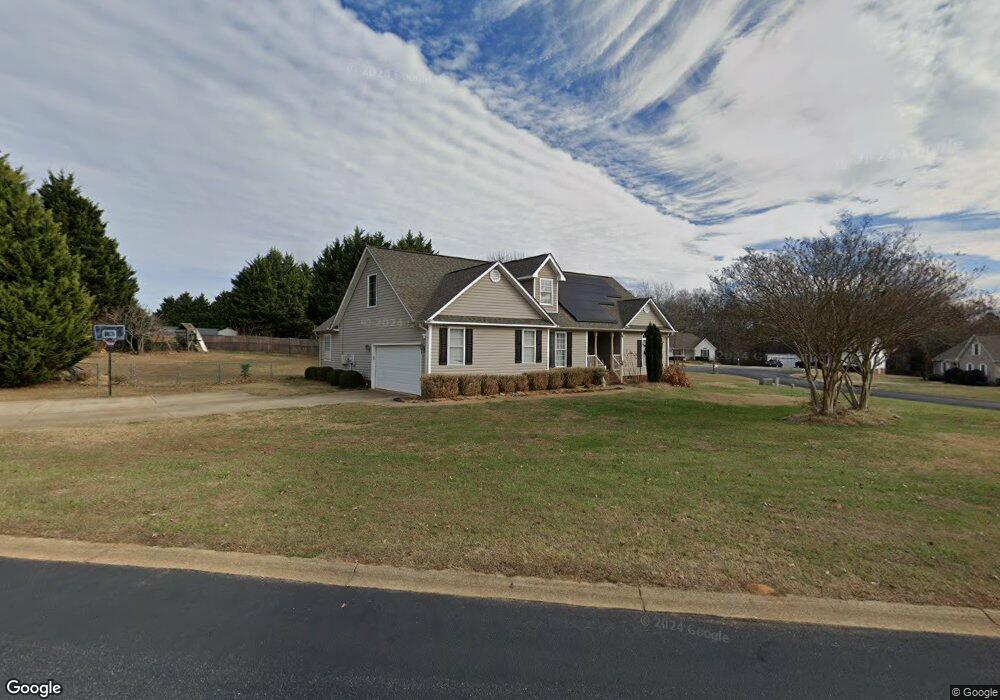
About This Home
This home is located at 221 Logan Michelle Run, Inman, SC 29349 and is currently estimated at $300,086, approximately $196 per square foot. 221 Logan Michelle Run is a home located in Spartanburg County with nearby schools including James H. Hendrix Elementary School, Boiling Springs Middle School, and Spartanburg Christian Academy.
Ownership History
Date
Name
Owned For
Owner Type
Purchase Details
Closed on
Jul 11, 2014
Sold by
Busko Vasiliy
Bought by
Veung Vorth and Phon Leapheary
Current Estimated Value
Home Financials for this Owner
Home Financials are based on the most recent Mortgage that was taken out on this home.
Original Mortgage
$142,405
Outstanding Balance
$108,511
Interest Rate
4.17%
Mortgage Type
New Conventional
Estimated Equity
$191,575
Purchase Details
Closed on
Dec 27, 2013
Sold by
Ulychick Vitaliy
Bought by
Busko Vasiliy
Purchase Details
Closed on
Nov 21, 2008
Sold by
Morris Roger K and Morris Kelly R
Bought by
Ilyuchick Vitaliy
Home Financials for this Owner
Home Financials are based on the most recent Mortgage that was taken out on this home.
Original Mortgage
$91,575
Interest Rate
5.89%
Mortgage Type
FHA
Purchase Details
Closed on
Feb 10, 2003
Sold by
Chris Morris Builders Inc
Bought by
Morris Kelly R and Mooris Roger K
Create a Home Valuation Report for This Property
The Home Valuation Report is an in-depth analysis detailing your home's value as well as a comparison with similar homes in the area
Home Values in the Area
Average Home Value in this Area
Purchase History
| Date | Buyer | Sale Price | Title Company |
|---|---|---|---|
| Veung Vorth | $149,900 | -- | |
| Busko Vasiliy | -- | -- | |
| Ilyuchick Vitaliy | $100,000 | -- | |
| Morris Kelly R | $131,900 | -- |
Source: Public Records
Mortgage History
| Date | Status | Borrower | Loan Amount |
|---|---|---|---|
| Open | Veung Vorth | $142,405 | |
| Previous Owner | Ilyuchick Vitaliy | $91,575 |
Source: Public Records
Tax History Compared to Growth
Tax History
| Year | Tax Paid | Tax Assessment Tax Assessment Total Assessment is a certain percentage of the fair market value that is determined by local assessors to be the total taxable value of land and additions on the property. | Land | Improvement |
|---|---|---|---|---|
| 2025 | $4,408 | $11,894 | $1,704 | $10,190 |
| 2024 | $4,408 | $11,894 | $1,704 | $10,190 |
| 2023 | $4,408 | $11,894 | $1,704 | $10,190 |
| 2022 | $4,005 | $10,343 | $1,239 | $9,104 |
| 2021 | $4,005 | $10,343 | $1,239 | $9,104 |
| 2020 | $3,977 | $10,343 | $1,239 | $9,104 |
| 2019 | $3,977 | $10,343 | $1,239 | $9,104 |
| 2018 | $3,873 | $10,343 | $1,239 | $9,104 |
| 2017 | $3,392 | $8,994 | $1,320 | $7,674 |
| 2016 | $3,392 | $8,994 | $1,320 | $7,674 |
| 2015 | $3,375 | $8,994 | $1,320 | $7,674 |
| 2014 | $3,083 | $8,220 | $1,320 | $6,900 |
Source: Public Records
Map
Nearby Homes
- 436 N Ivestor Ct
- 2014 Southlea Dr
- 523 Bailey Elizabeth Way
- 3002 Wingadee Dr
- 331 S Ivestor Ct
- 770 Ship Wreck Place
- 750 Ship Wreck Place
- 6090 Mason Tucker Dr
- 1450 Cattleman Acres Dr
- 1450 Cattleman Acres Dr Unit MD 164 Emerson VE B
- 4033 Rustling Grass Trail
- 3086 Whispering Willow Ct
- 3086 Whispering Willow Ct Unit MT 64 Chestnut A
- 3082 Whispering Willow Ct
- 3082 Whispering Willow Ct Unit MT 65 Magnolia B
- 3070 Whispering Willow Ct Unit MT 68 Chestnut AER
- 3070 Whispering Willow Ct
- 3064 Whispering Willow Ct
- 3064 Whispering Willow Ct Unit MT 69 Magnolia BEL
- 262 Highland Springs Loop
- 415 Carter Joshua Trail
- 220 Logan Michelle Run
- 207 Logan Michelle Run
- 423 Carter Joshua Trail
- 1424 Clark Rd
- 412 Carter Joshua Trail
- 406 Carter Joshua Trail
- 206 Logan Michelle Run
- 418 Carter Joshua Trail
- 430 Carter Joshua Trail
- 1428 Clark Rd
- 424 Carter Joshua Trail
- 307 Mollys Way
- 314 Mollys Way
- 1360 Clark Rd
- 320 Mollys Way
- 319 Mollys Way
- 1432 Clark Rd
- 313 Mollys Way
- 1350 Clark Rd