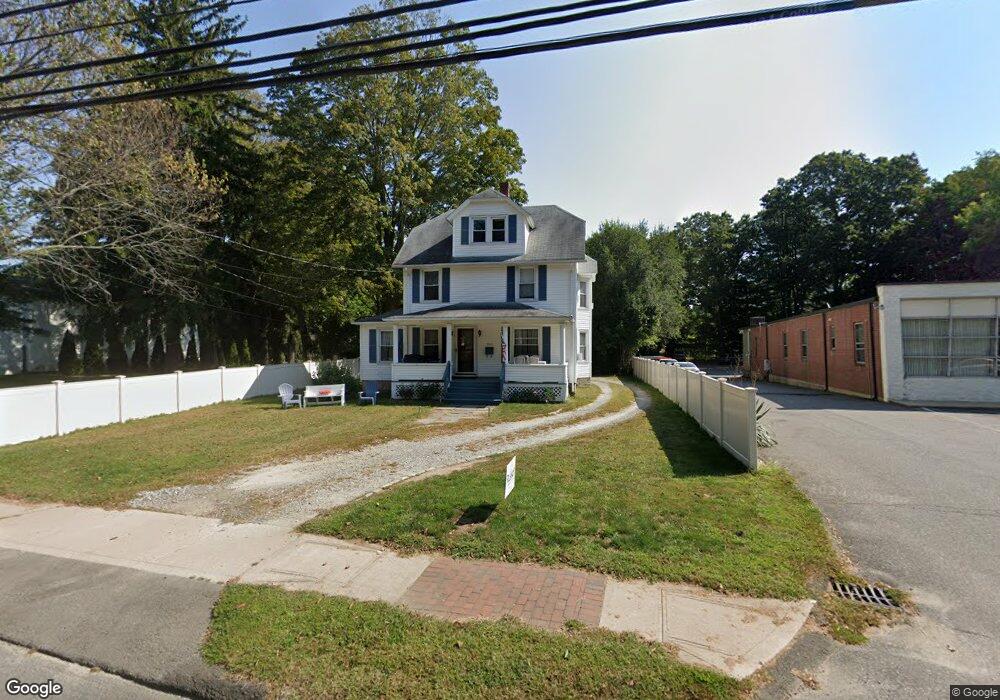
221 Main St Deep River, CT 06417
Estimated Value: $333,000 - $486,000
3
Beds
3
Baths
1,442
Sq Ft
$271/Sq Ft
Est. Value
About This Home
This home is located at 221 Main St, Deep River, CT 06417 and is currently estimated at $391,333, approximately $271 per square foot. 221 Main St is a home located in Middlesex County with nearby schools including Valley Regional High School.
Ownership History
Date
Name
Owned For
Owner Type
Purchase Details
Closed on
Dec 19, 2019
Sold by
Clark
Bought by
G
Current Estimated Value
Home Financials for this Owner
Home Financials are based on the most recent Mortgage that was taken out on this home.
Original Mortgage
$1,000,000
Outstanding Balance
$879,742
Interest Rate
3.6%
Mortgage Type
New Conventional
Estimated Equity
-$488,409
Purchase Details
Closed on
Jan 3, 2011
Sold by
Anselmi Richard
Bought by
Clark Herbert
Home Financials for this Owner
Home Financials are based on the most recent Mortgage that was taken out on this home.
Original Mortgage
$165,000
Interest Rate
4.37%
Mortgage Type
Purchase Money Mortgage
Purchase Details
Closed on
Oct 17, 2001
Sold by
Larson Antonia B Est and Bombaci
Bought by
Anselmi Richard J
Create a Home Valuation Report for This Property
The Home Valuation Report is an in-depth analysis detailing your home's value as well as a comparison with similar homes in the area
Home Values in the Area
Average Home Value in this Area
Purchase History
| Date | Buyer | Sale Price | Title Company |
|---|---|---|---|
| G | -- | None Available | |
| Clark Herbert | $220,000 | -- | |
| Anselmi Richard J | $168,000 | -- |
Source: Public Records
Mortgage History
| Date | Status | Borrower | Loan Amount |
|---|---|---|---|
| Open | G | $1,000,000 | |
| Closed | G | $1,000,000 | |
| Previous Owner | Anselmi Richard J | $165,000 |
Source: Public Records
Tax History Compared to Growth
Tax History
| Year | Tax Paid | Tax Assessment Tax Assessment Total Assessment is a certain percentage of the fair market value that is determined by local assessors to be the total taxable value of land and additions on the property. | Land | Improvement |
|---|---|---|---|---|
| 2025 | $5,205 | $162,750 | $41,510 | $121,240 |
| 2024 | $4,997 | $159,250 | $41,510 | $117,740 |
| 2023 | $4,758 | $159,250 | $41,510 | $117,740 |
| 2022 | $4,615 | $159,250 | $41,510 | $117,740 |
| 2021 | $4,711 | $159,250 | $41,510 | $117,740 |
| 2020 | $4,854 | $161,840 | $41,510 | $120,330 |
| 2019 | $4,761 | $161,840 | $41,510 | $120,330 |
| 2018 | $4,761 | $161,840 | $41,510 | $120,330 |
| 2017 | $4,680 | $161,840 | $41,510 | $120,330 |
| 2016 | $4,455 | $161,840 | $41,510 | $120,330 |
| 2015 | $4,270 | $162,470 | $42,140 | $120,330 |
| 2014 | $4,205 | $162,470 | $42,140 | $120,330 |
Source: Public Records
Map
Nearby Homes