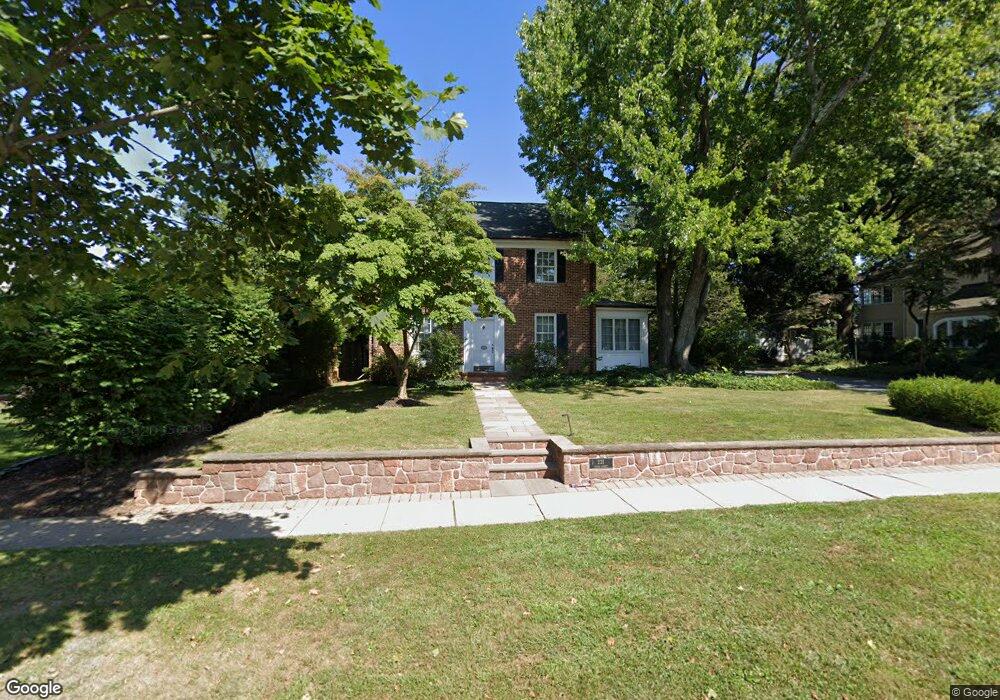
221 Moore St Princeton, NJ 08540
Estimated Value: $995,000 - $1,378,000
3
Beds
2
Baths
1,600
Sq Ft
$741/Sq Ft
Est. Value
About This Home
This home is located at 221 Moore St, Princeton, NJ 08540 and is currently estimated at $1,185,042, approximately $740 per square foot. 221 Moore St is a home located in Mercer County with nearby schools including Community Park Elementary School, Princeton Middle School, and Princeton High School.
Ownership History
Date
Name
Owned For
Owner Type
Purchase Details
Closed on
Jul 16, 2009
Sold by
Winarsky Living Trust and Winarsky Norman
Bought by
Munie Kenneth R and Nikolovski Janeta
Current Estimated Value
Home Financials for this Owner
Home Financials are based on the most recent Mortgage that was taken out on this home.
Original Mortgage
$120,000
Interest Rate
4.92%
Mortgage Type
Stand Alone Second
Purchase Details
Closed on
Mar 7, 2008
Sold by
Winarsky Norman and Winarsky Lisbeth
Bought by
Winarsky Living Tr
Create a Home Valuation Report for This Property
The Home Valuation Report is an in-depth analysis detailing your home's value as well as a comparison with similar homes in the area
Home Values in the Area
Average Home Value in this Area
Purchase History
| Date | Buyer | Sale Price | Title Company |
|---|---|---|---|
| Munie Kenneth R | $680,000 | None Available | |
| Winarsky Living Tr | -- | -- |
Source: Public Records
Mortgage History
| Date | Status | Borrower | Loan Amount |
|---|---|---|---|
| Closed | Munie Kenneth R | $120,000 | |
| Open | Munie Kenneth R | $417,000 |
Source: Public Records
Tax History Compared to Growth
Tax History
| Year | Tax Paid | Tax Assessment Tax Assessment Total Assessment is a certain percentage of the fair market value that is determined by local assessors to be the total taxable value of land and additions on the property. | Land | Improvement |
|---|---|---|---|---|
| 2025 | $18,250 | $787,700 | $439,800 | $347,900 |
| 2024 | $17,228 | $685,300 | $439,800 | $245,500 |
| 2023 | $17,228 | $685,300 | $439,800 | $245,500 |
| 2022 | $16,667 | $685,300 | $439,800 | $245,500 |
| 2021 | $16,714 | $685,300 | $439,800 | $245,500 |
| 2020 | $16,584 | $685,300 | $439,800 | $245,500 |
| 2019 | $16,255 | $685,300 | $439,800 | $245,500 |
| 2018 | $15,981 | $685,300 | $439,800 | $245,500 |
| 2017 | $15,376 | $668,500 | $461,000 | $207,500 |
| 2016 | $15,135 | $668,500 | $461,000 | $207,500 |
| 2015 | $14,787 | $668,500 | $461,000 | $207,500 |
| 2014 | $14,607 | $668,500 | $461,000 | $207,500 |
Source: Public Records
Map
Nearby Homes
- 189 Moore St
- 261 Moore St
- 3 Harris Rd
- 174 Linden Ln
- 22 Valley Rd
- 57 Moran Ave
- 30 Maclean St
- 74 Leigh Ave
- 433 Walnut Ln
- 722 Avery Ln
- 721 Avery Ln
- 380 Franklin Ave
- 16 Cameron Ct
- 132 Victoria Mews
- 20 Paul Robeson Place
- 98 Nassau St Unit 3
- 48 Nassau St Unit I
- 49 Palmer Square W Unit D
- 267 Hamilton Ave
- 201 Grover Ave