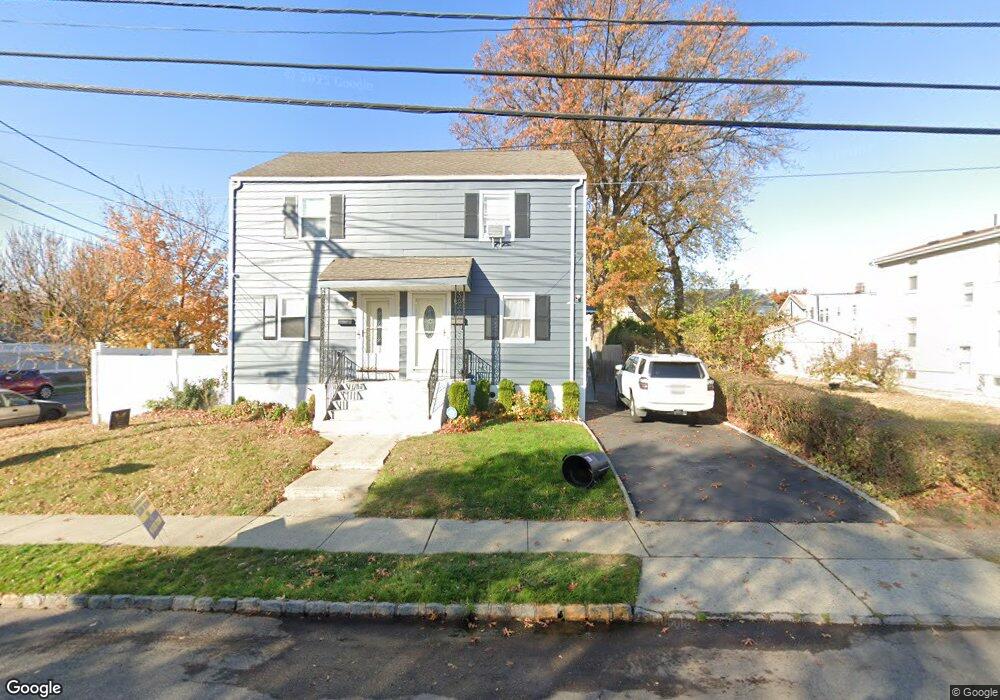
221 N 16th St Bloomfield, NJ 07003
Estimated Value: $286,000 - $390,000
--
Bed
--
Bath
832
Sq Ft
$418/Sq Ft
Est. Value
About This Home
This home is located at 221 N 16th St, Bloomfield, NJ 07003 and is currently estimated at $347,641, approximately $417 per square foot. 221 N 16th St is a home located in Essex County with nearby schools including Carteret School, Bloomfield Middle School, and Bloomfield High School.
Ownership History
Date
Name
Owned For
Owner Type
Purchase Details
Closed on
Dec 17, 2004
Sold by
Tapia Reiser
Bought by
Persuad Nadira
Current Estimated Value
Home Financials for this Owner
Home Financials are based on the most recent Mortgage that was taken out on this home.
Original Mortgage
$184,500
Outstanding Balance
$92,398
Interest Rate
5.73%
Mortgage Type
Purchase Money Mortgage
Estimated Equity
$255,243
Purchase Details
Closed on
May 10, 2002
Sold by
Montano Marie
Bought by
Tapia Reiser
Home Financials for this Owner
Home Financials are based on the most recent Mortgage that was taken out on this home.
Original Mortgage
$85,500
Interest Rate
7%
Create a Home Valuation Report for This Property
The Home Valuation Report is an in-depth analysis detailing your home's value as well as a comparison with similar homes in the area
Home Values in the Area
Average Home Value in this Area
Purchase History
| Date | Buyer | Sale Price | Title Company |
|---|---|---|---|
| Persuad Nadira | $205,000 | -- | |
| Tapia Reiser | $95,000 | -- |
Source: Public Records
Mortgage History
| Date | Status | Borrower | Loan Amount |
|---|---|---|---|
| Open | Persuad Nadira | $184,500 | |
| Previous Owner | Tapia Reiser | $85,500 |
Source: Public Records
Tax History Compared to Growth
Tax History
| Year | Tax Paid | Tax Assessment Tax Assessment Total Assessment is a certain percentage of the fair market value that is determined by local assessors to be the total taxable value of land and additions on the property. | Land | Improvement |
|---|---|---|---|---|
| 2025 | $5,869 | $179,600 | $96,900 | $82,700 |
| 2024 | $5,869 | $179,600 | $96,900 | $82,700 |
| 2022 | $5,751 | $179,600 | $96,900 | $82,700 |
| 2021 | $5,645 | $179,600 | $96,900 | $82,700 |
| 2020 | $5,559 | $179,600 | $96,900 | $82,700 |
| 2019 | $6,019 | $151,200 | $96,000 | $55,200 |
| 2018 | $5,994 | $151,200 | $96,000 | $55,200 |
| 2017 | $5,903 | $151,200 | $96,000 | $55,200 |
| 2016 | $5,836 | $151,200 | $96,000 | $55,200 |
| 2015 | $5,783 | $151,200 | $96,000 | $55,200 |
| 2014 | $5,678 | $151,200 | $96,000 | $55,200 |
Source: Public Records
Map
Nearby Homes
- 220 N 17th St
- 219 N 16th St
- 228 N 17th St
- 413 Beardsley Ave Unit 3
- 413 Beardsley Ave
- 200 N 15th St
- 265 N 17th St
- 267 N 17th St
- 141 N 16th St
- 20 Heckel St Unit 3
- 20 Heckel St
- 149 Leslie St
- 23 Belmont Ave
- 431 N 12th St
- 489 N 11th St Unit 491
- 41 Heckel St
- 108 Davenport Ave
- 18 Brook St
- 18 Whitman Ave
- 7 Whitman Ave