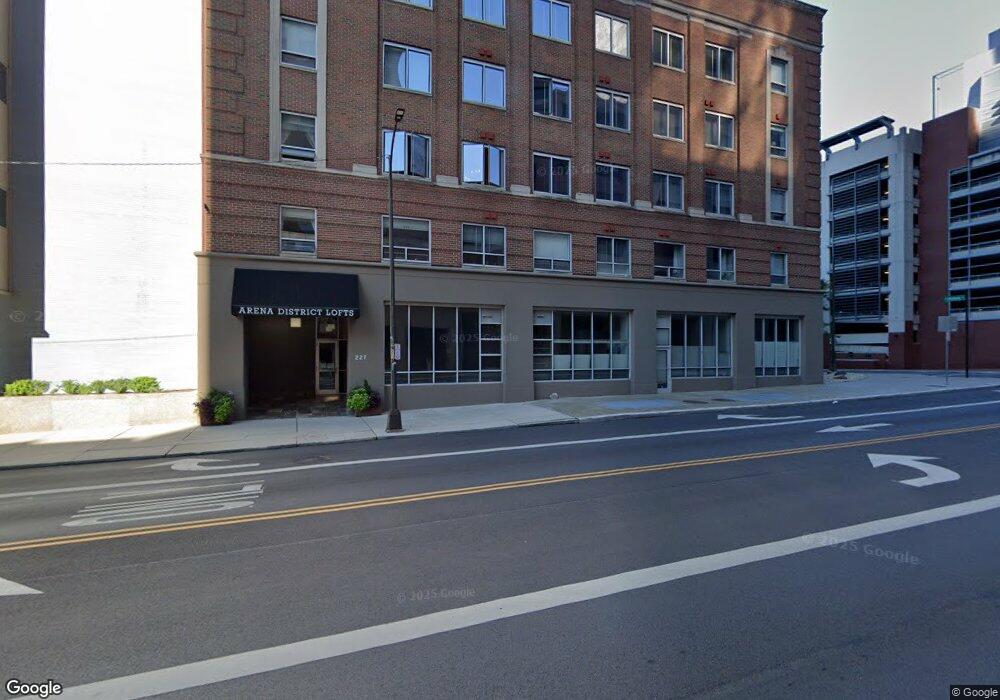
The Arena District Lofts 221 N Front St Columbus, OH 43215
North Bank Park NeighborhoodEstimated Value: $275,000 - $333,000
1
Bed
2
Baths
1,174
Sq Ft
$253/Sq Ft
Est. Value
About This Home
This home is located at 221 N Front St, Columbus, OH 43215 and is currently estimated at $297,252, approximately $253 per square foot. 221 N Front St is a home located in Franklin County with nearby schools including Hubbard Elementary School, Dominion Middle School, and Whetstone High School.
Ownership History
Date
Name
Owned For
Owner Type
Purchase Details
Closed on
Sep 30, 2020
Sold by
Freshour Carol
Bought by
Katz Ezra and Kaufman Drew L
Current Estimated Value
Home Financials for this Owner
Home Financials are based on the most recent Mortgage that was taken out on this home.
Original Mortgage
$218,250
Outstanding Balance
$194,122
Interest Rate
2.9%
Mortgage Type
New Conventional
Estimated Equity
$103,130
Purchase Details
Closed on
Dec 28, 2011
Sold by
Ferris David A and Ferris Karen J
Bought by
Freshour Carol
Home Financials for this Owner
Home Financials are based on the most recent Mortgage that was taken out on this home.
Original Mortgage
$184,410
Interest Rate
3.98%
Mortgage Type
New Conventional
Purchase Details
Closed on
Apr 13, 2006
Sold by
221 North Front Street Llc
Bought by
Ferris David A and Ferris Karen J
Home Financials for this Owner
Home Financials are based on the most recent Mortgage that was taken out on this home.
Original Mortgage
$277,211
Interest Rate
7.25%
Mortgage Type
Fannie Mae Freddie Mac
Create a Home Valuation Report for This Property
The Home Valuation Report is an in-depth analysis detailing your home's value as well as a comparison with similar homes in the area
Home Values in the Area
Average Home Value in this Area
Purchase History
| Date | Buyer | Sale Price | Title Company |
|---|---|---|---|
| Katz Ezra | $242,500 | Northwest Ttl Fam Of Compani | |
| Freshour Carol | $204,900 | Stewart Title Agency Of Colu | |
| Ferris David A | $308,100 | Title First |
Source: Public Records
Mortgage History
| Date | Status | Borrower | Loan Amount |
|---|---|---|---|
| Open | Katz Ezra | $218,250 | |
| Previous Owner | Freshour Carol | $184,410 | |
| Previous Owner | Ferris David A | $277,211 |
Source: Public Records
Tax History Compared to Growth
Tax History
| Year | Tax Paid | Tax Assessment Tax Assessment Total Assessment is a certain percentage of the fair market value that is determined by local assessors to be the total taxable value of land and additions on the property. | Land | Improvement |
|---|---|---|---|---|
| 2024 | $4,177 | $93,080 | $19,430 | $73,650 |
| 2023 | $4,124 | $93,065 | $19,425 | $73,640 |
| 2022 | $4,402 | $84,880 | $18,900 | $65,980 |
| 2021 | $4,410 | $84,880 | $18,900 | $65,980 |
| 2020 | $4,603 | $84,880 | $18,900 | $65,980 |
| 2019 | $5,343 | $84,990 | $15,750 | $69,240 |
| 2018 | $3,223 | $84,990 | $15,750 | $69,240 |
| 2017 | $1,469 | $84,980 | $15,750 | $69,230 |
| 2016 | $1,207 | $84,000 | $8,400 | $75,600 |
| 2015 | $926 | $84,000 | $8,400 | $75,600 |
| 2014 | $928 | $84,000 | $8,400 | $75,600 |
| 2013 | $414 | $10,780 | $3,780 | $7,000 |
Source: Public Records
About The Arena District Lofts
Map
Nearby Homes
- 221 N Front St Unit 308
- 106 N High St Unit 105
- 106 N High St Unit 102
- 106 N High St Unit 205
- 60 E Spring St Unit 601
- 60 E Spring St Unit 215 COURTYARD
- 60 E Spring St Unit 220 W. TERRACE
- 60 E Spring St Unit 401
- 60 E Spring St Unit 211
- 60 E Spring St Unit 412
- 250 Daniel Burnham Square Unit 304
- 250 Daniel Burnham Square Unit TH253
- 250 W Spring St Unit 326
- 250 W Spring St Unit 613
- 250 W Spring St Unit 522
- 250 W Spring St Unit 526
- 250 W Spring St Unit 1216
- 250 W Spring St Unit 243
- 225 John H McConnell Blvd Unit 407
- 51 N High St Unit 307
- 221 N Front St Unit 509
- 221 N Front St Unit 105
- 221 N Front St
- 221 N Front St
- 221 N Front St
- 221 N Front St
- 221 N Front St
- 221 N Front St
- 221 N Front St
- 221 N Front St
- 221 N Front St
- 221 N Front St
- 221 N Front St
- 221 N Front St
- 221 N Front St
- 221 N Front St
- 221 N Front St
- 221 N Front St
- 221 N Front St
- 221 N Front St Unit 407