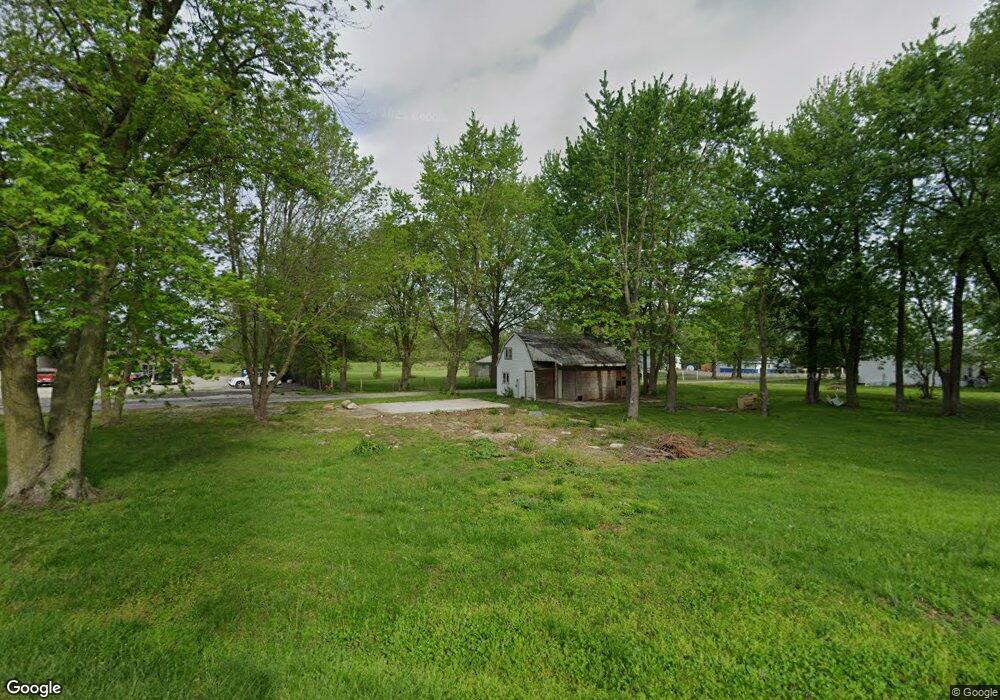
221 N Goltra St Blue Mound, IL 62513
Estimated Value: $68,343 - $187,000
--
Bed
--
Bath
1,348
Sq Ft
$99/Sq Ft
Est. Value
About This Home
This home is located at 221 N Goltra St, Blue Mound, IL 62513 and is currently estimated at $133,836, approximately $99 per square foot. 221 N Goltra St is a home with nearby schools including Meridian Middle School and Meridian High School.
Ownership History
Date
Name
Owned For
Owner Type
Purchase Details
Closed on
Jun 27, 2022
Sold by
Norman Kenneth E
Bought by
Foulks Jeffery H
Current Estimated Value
Purchase Details
Closed on
Jun 17, 2022
Sold by
Arthur Norman
Bought by
Norman Kenneth E
Purchase Details
Closed on
May 14, 2013
Sold by
Fannie Mae
Bought by
Norman Kenneth E and Norman Linda K
Purchase Details
Closed on
Feb 19, 2013
Sold by
Sperry Jerry E
Bought by
Federal National Mortgage Association
Purchase Details
Closed on
Nov 27, 2007
Sold by
Trimble Renae L and Moore Cindy S
Bought by
Sperry Kirk E
Create a Home Valuation Report for This Property
The Home Valuation Report is an in-depth analysis detailing your home's value as well as a comparison with similar homes in the area
Home Values in the Area
Average Home Value in this Area
Purchase History
| Date | Buyer | Sale Price | Title Company |
|---|---|---|---|
| Foulks Jeffery H | $7,000 | None Listed On Document | |
| Norman Kenneth E | -- | None Listed On Document | |
| Norman Kenneth E | $14,000 | None Available | |
| Federal National Mortgage Association | -- | None Available | |
| Sperry Kirk E | -- | None Available |
Source: Public Records
Tax History Compared to Growth
Tax History
| Year | Tax Paid | Tax Assessment Tax Assessment Total Assessment is a certain percentage of the fair market value that is determined by local assessors to be the total taxable value of land and additions on the property. | Land | Improvement |
|---|---|---|---|---|
| 2024 | $228 | $2,599 | $1,605 | $994 |
| 2023 | $142 | $1,571 | $1,455 | $116 |
| 2022 | $0 | $3,524 | $1,390 | $2,134 |
| 2021 | $18 | $5,261 | $1,320 | $3,941 |
| 2020 | $5 | $4,957 | $1,244 | $3,713 |
| 2019 | $5 | $4,957 | $1,244 | $3,713 |
| 2018 | $0 | $4,839 | $1,214 | $3,625 |
| 2017 | $10 | $4,859 | $1,219 | $3,640 |
| 2016 | $0 | $4,854 | $1,218 | $3,636 |
| 2015 | $10 | $4,713 | $1,183 | $3,530 |
| 2014 | $10 | $4,666 | $1,171 | $3,495 |
| 2013 | $254 | $4,666 | $1,171 | $3,495 |
Source: Public Records
Map
Nearby Homes
- 117 S Sunnyside Dr
- 1955 E 2700 Rd N
- 105 S Maple St
- 310 S Pine St
- 275 W Cole St
- 206 W Andrews St
- 161 N Front St
- 375 E Cook St
- 124 Robin Dr
- 3335 Nevada Rd
- 803 N Putnam St
- 317 W Madison St
- 241 W Main St
- 319 N Macon St
- 429 N Shelby St
- 320 E Elm St
- 0 E Main St
- 309 E Temple St
- 1798 E 1685 Rd N
- 116 E Center St
- 318 W Aholt St
- 330 N West St
- 306 W Aholt St
- 189 N West St
- 341 N West St
- 245 W Mound St
- 325 W Aholt St
- 301 N Cantrell St
- 401 W North St
- 301 W Mound St
- 326 North St
- 229 N Railroad Ave
- 318 North St
- 320 North St
- 313 N Cantrell St
- 313 N Goltra St
- 301 N Railroad Ave
- 310 N Cantrell St
- 230 W Niles St
- 314 N Cantrell St