Estimated Value: $509,000 - $658,000
4
Beds
2
Baths
2,000
Sq Ft
$299/Sq Ft
Est. Value
About This Home
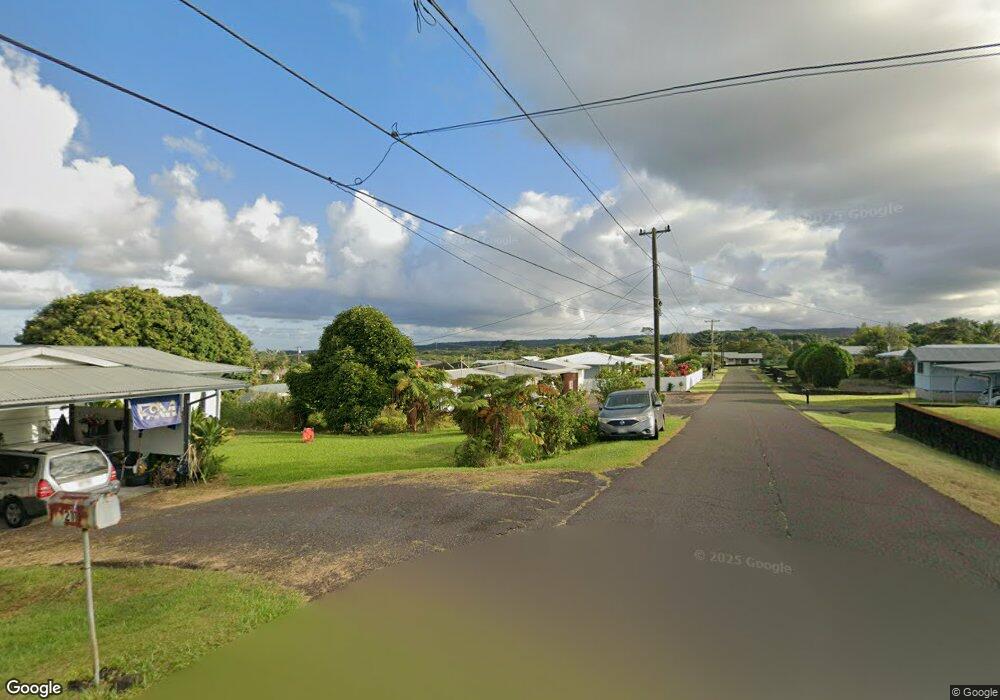
This home is located at 221 Palua Loop, Hilo, HI 96720 and is currently estimated at $597,883, approximately $298 per square foot. 221 Palua Loop is a home located in Hawaii County with nearby schools including Waiakeawaena Elementary School, Waiakea Intermediate School, and Waiakea High School.
Ownership History
Date
Name
Owned For
Owner Type
Purchase Details
Closed on
Aug 5, 2021
Sold by
Harada Rodney M and Harada Carolyn N
Bought by
Sueoka Jennifer Naomi and Sueoka Rod Kelelani
Current Estimated Value
Home Financials for this Owner
Home Financials are based on the most recent Mortgage that was taken out on this home.
Original Mortgage
$190,000
Interest Rate
2.1%
Mortgage Type
New Conventional
Purchase Details
Closed on
Feb 3, 2005
Sold by
Harada Rodney M and Harada Carolyn N
Bought by
Harada Rodney M and Harada Carolyn N
Create a Home Valuation Report for This Property
The Home Valuation Report is an in-depth analysis detailing your home's value as well as a comparison with similar homes in the area
Home Values in the Area
Average Home Value in this Area
Purchase History
| Date | Buyer | Sale Price | Title Company |
|---|---|---|---|
| Sueoka Jennifer Naomi | -- | Tg | |
| Harada Rodney M | $129,000 | -- |
Source: Public Records
Mortgage History
| Date | Status | Borrower | Loan Amount |
|---|---|---|---|
| Closed | Sueoka Jennifer Naomi | $190,000 |
Source: Public Records
Tax History Compared to Growth
Tax History
| Year | Tax Paid | Tax Assessment Tax Assessment Total Assessment is a certain percentage of the fair market value that is determined by local assessors to be the total taxable value of land and additions on the property. | Land | Improvement |
|---|---|---|---|---|
| 2025 | $100 | $531,400 | $240,200 | $291,200 |
| 2024 | $100 | $496,800 | $218,000 | $278,800 |
| 2023 | $100 | $463,000 | $203,700 | $259,300 |
| 2022 | $4,795 | $432,000 | $172,700 | $259,300 |
| 2021 | $4,332 | $390,300 | $165,200 | $225,100 |
| 2020 | $4,110 | $370,300 | $156,200 | $214,100 |
| 2019 | $3,997 | $360,100 | $150,200 | $209,900 |
| 2018 | $3,531 | $318,100 | $150,200 | $167,900 |
| 2017 | $456 | $217,800 | $72,600 | $145,200 |
| 2016 | $426 | $211,500 | $72,600 | $138,900 |
| 2015 | $366 | $205,300 | $72,600 | $132,700 |
| 2014 | $366 | $199,300 | $72,600 | $126,700 |
Source: Public Records
Map
Nearby Homes
- 250 Laula
- 106 Laula Rd
- 280 Laula Rd
- 1646 Oneawa Place
- 508 Ekela St
- 1594 Kaunala Place
- 527 Iwalani St
- 446 Ainaola Dr
- 3047 Lou St
- 0 Ainalako Rd
- 450 Pohakulani St
- 2615 Kinoole St
- 2557 Kinoole St
- 845 Uilani Place
- 420 Ainalako Rd
- 1588 Mailani St
- 723 W Kawailani St
- 114 Hale Manu Dr
- 806 Uilani Place
- 856 Hoolala Place