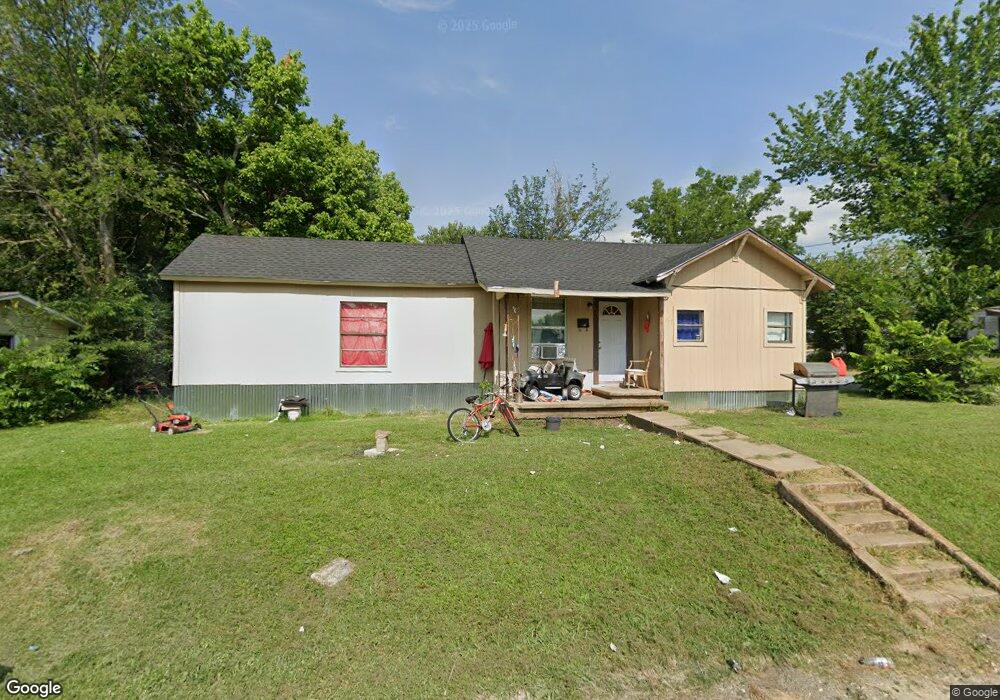
221 Pine St Bonham, TX 75418
Estimated Value: $88,148 - $155,000
2
Beds
1
Bath
972
Sq Ft
$126/Sq Ft
Est. Value
About This Home
This home is located at 221 Pine St, Bonham, TX 75418 and is currently estimated at $122,787, approximately $126 per square foot. 221 Pine St is a home located in Fannin County with nearby schools including Evans Elementary School, Finley-Oates Elementary School, and LH Rather Jr High School.
Ownership History
Date
Name
Owned For
Owner Type
Purchase Details
Closed on
Oct 2, 2010
Sold by
J& J Lending Corp
Bought by
Hernandez Sergio and Hernandez Angelica
Current Estimated Value
Purchase Details
Closed on
Aug 3, 2010
Sold by
Massey Karla C
Bought by
J&J Lending Corp
Purchase Details
Closed on
Nov 2, 2009
Sold by
J & J Lending Corp
Bought by
Massey Karla C
Purchase Details
Closed on
May 5, 2009
Sold by
Jiminez Richardo Ballesteros and Gray Kristina
Bought by
J & J Lending Corporation
Purchase Details
Closed on
Sep 5, 2008
Sold by
J&J Lending Corp
Bought by
Jiminez Ricardo Ballesteros and Gray Kristina
Purchase Details
Closed on
Jun 5, 2008
Sold by
Brown Sharon
Bought by
J&J Lending Corp
Create a Home Valuation Report for This Property
The Home Valuation Report is an in-depth analysis detailing your home's value as well as a comparison with similar homes in the area
Purchase History
| Date | Buyer | Sale Price | Title Company |
|---|---|---|---|
| Hernandez Sergio | -- | None Available | |
| J&J Lending Corp | $30,548 | None Available | |
| Massey Karla C | -- | None Available | |
| J & J Lending Corporation | -- | None Available | |
| Jiminez Ricardo Ballesteros | -- | None Available | |
| J&J Lending Corp | -- | None Available |
Source: Public Records
Mortgage History
| Date | Status | Borrower | Loan Amount |
|---|---|---|---|
| Closed | Jiminez Ricardo Ballesteros | $0 |
Source: Public Records
Tax History
| Year | Tax Paid | Tax Assessment Tax Assessment Total Assessment is a certain percentage of the fair market value that is determined by local assessors to be the total taxable value of land and additions on the property. | Land | Improvement |
|---|---|---|---|---|
| 2025 | $1,052 | $54,250 | $17,530 | $36,720 |
| 2024 | $1,031 | $53,140 | $15,180 | $37,960 |
| 2023 | $1,047 | $53,110 | $14,440 | $38,670 |
| 2022 | $1,144 | $52,030 | $14,440 | $37,590 |
| 2021 | $713 | $28,220 | $4,750 | $23,470 |
| 2020 | $642 | $25,130 | $2,840 | $22,290 |
| 2019 | $593 | $22,300 | $1,810 | $20,490 |
| 2018 | $585 | $22,050 | $1,630 | $20,420 |
| 2017 | $570 | $22,310 | $1,540 | $20,770 |
| 2016 | $565 | $22,090 | $1,540 | $20,550 |
| 2015 | -- | $16,290 | $1,450 | $14,840 |
| 2014 | -- | $18,070 | $2,010 | $16,060 |
Source: Public Records
Map
Nearby Homes
- 202 Pine St
- 102 Elm St
- 306 E 2nd St
- 514 E 5th St
- 420 E 5th St
- 520 E 5th St
- 314 E 2nd St
- 716 E 5th St
- 410 E 6th St
- 700 E 6th St
- LOT 2 TBD County Road 2005
- TBD W Fm 274
- TBD LOT 1 County Road 2005
- tbd lot 3 County Road 2005
- 808 E 3rd St
- 808 E 6th St
- 816 E 6th St
- 503 Katy Blvd
- 820 E 6th St
- 611 Chestnut St
- 609 E 3rd St
- 301 Pine St
- 605 E 3rd St Unit A
- 605 E 3rd St
- 514 E 3rd St
- 519 E 2nd St
- 520 E Sam Rayburn Dr
- 513 E 2nd St
- 220 Elm St
- 210 Elm St
- 602 E Sam Rayburn Dr
- 200 Pine St
- 604 E 3rd St Unit 2
- 604 E 3rd St Unit A & B
- 604 E 3rd St
- 202 Elm St
- 620 E Sam Rayburn Dr Unit RAYBURN
- 615 E 2nd Lot 6 St
- 615 E 2nd Lot 7 St
- 612 E 3rd St Unit 1
Your Personal Tour Guide
Ask me questions while you tour the home.