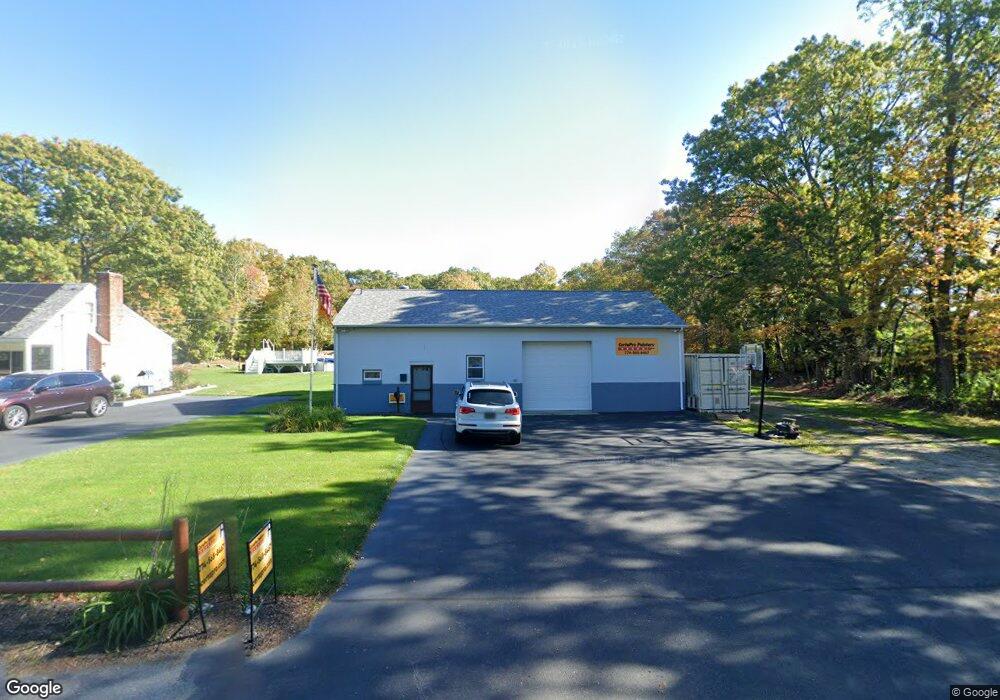
221 Plain St Unit 1 Rehoboth, MA 02769
Estimated Value: $625,152
3
Beds
2
Baths
1,500
Sq Ft
$417/Sq Ft
Est. Value
About This Home
This home is located at 221 Plain St Unit 1, Rehoboth, MA 02769 and is currently estimated at $625,152, approximately $416 per square foot. 221 Plain St Unit 1 is a home located in Bristol County with nearby schools including Dighton-Rehoboth Regional High School.
Ownership History
Date
Name
Owned For
Owner Type
Purchase Details
Closed on
Jun 30, 2016
Sold by
Seaside Systems Props
Bought by
Hasson Randy L and Hasson Tina L
Current Estimated Value
Home Financials for this Owner
Home Financials are based on the most recent Mortgage that was taken out on this home.
Original Mortgage
$170,000
Outstanding Balance
$134,978
Interest Rate
3.58%
Mortgage Type
Commercial
Estimated Equity
$490,174
Purchase Details
Closed on
Apr 12, 2007
Sold by
Guertin David A and Guertin Alison C
Bought by
Seaside Sys Prop Inc
Home Financials for this Owner
Home Financials are based on the most recent Mortgage that was taken out on this home.
Original Mortgage
$392,000
Interest Rate
6.24%
Mortgage Type
Commercial
Purchase Details
Closed on
Dec 20, 1994
Sold by
Guertin Robert and Guertin Maion I
Bought by
Guertin David and Guertin Rodney
Create a Home Valuation Report for This Property
The Home Valuation Report is an in-depth analysis detailing your home's value as well as a comparison with similar homes in the area
Home Values in the Area
Average Home Value in this Area
Purchase History
| Date | Buyer | Sale Price | Title Company |
|---|---|---|---|
| Hasson Randy L | $319,000 | -- | |
| Seaside Sys Prop Inc | $391,000 | -- | |
| Seaside Sys Prop Inc | $391,000 | -- | |
| Guertin David | $130,000 | -- | |
| Guertin David | $130,000 | -- |
Source: Public Records
Mortgage History
| Date | Status | Borrower | Loan Amount |
|---|---|---|---|
| Open | Hasson Randy L | $170,000 | |
| Closed | Guertin David | $170,000 | |
| Previous Owner | Seaside Sys Prop Inc | $392,000 |
Source: Public Records
Tax History Compared to Growth
Tax History
| Year | Tax Paid | Tax Assessment Tax Assessment Total Assessment is a certain percentage of the fair market value that is determined by local assessors to be the total taxable value of land and additions on the property. | Land | Improvement |
|---|---|---|---|---|
| 2025 | $55 | $494,500 | $144,500 | $350,000 |
| 2024 | $4,968 | $437,300 | $134,800 | $302,500 |
| 2023 | $5,032 | $434,500 | $134,800 | $299,700 |
| 2022 | $4,793 | $378,300 | $134,800 | $243,500 |
| 2021 | $3,255 | $376,900 | $134,800 | $242,100 |
| 2020 | $4,495 | $342,600 | $134,800 | $207,800 |
| 2018 | $3,773 | $315,200 | $134,800 | $180,400 |
| 2017 | $3,408 | $289,800 | $134,800 | $155,000 |
| 2016 | $3,414 | $281,000 | $134,800 | $146,200 |
| 2015 | $4,323 | $351,200 | $193,400 | $157,800 |
| 2014 | $4,269 | $343,200 | $193,400 | $149,800 |
Source: Public Records
Map
Nearby Homes