Estimated Value: $308,000 - $347,000
3
Beds
2
Baths
1,511
Sq Ft
$217/Sq Ft
Est. Value
About This Home
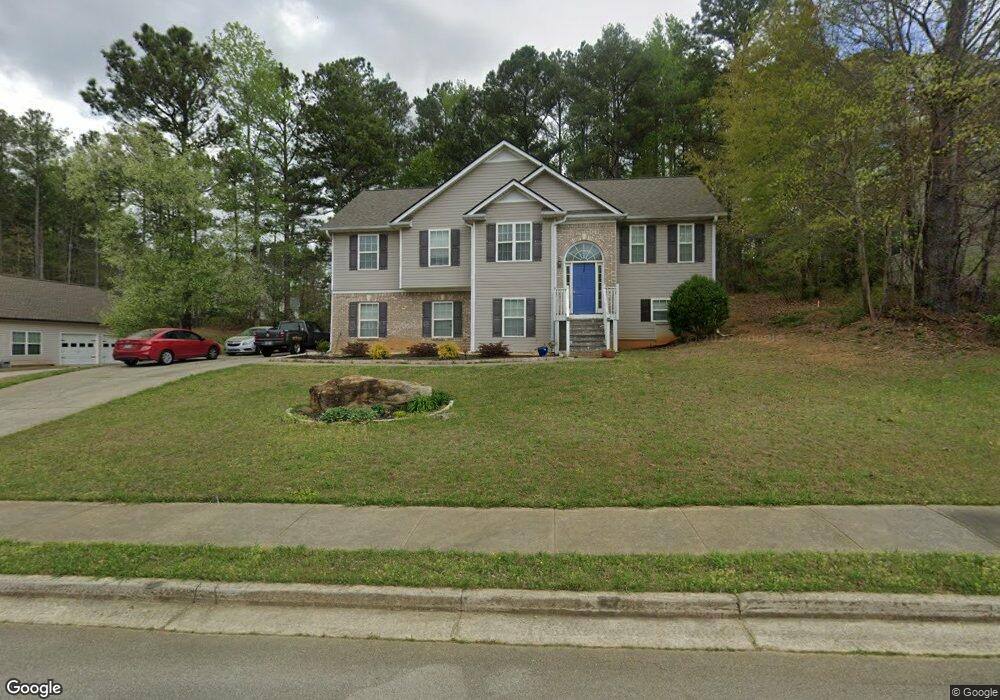
This home is located at 221 Polo Crossing, Hiram, GA 30141 and is currently estimated at $328,386, approximately $217 per square foot. 221 Polo Crossing is a home located in Paulding County with nearby schools including Sam D. Panter Elementary School, J. A. Dobbins Middle School, and Hiram High School.
Ownership History
Date
Name
Owned For
Owner Type
Purchase Details
Closed on
May 28, 2010
Sold by
Bowers Ian R
Bought by
Bowers Ian R and Bowers April W
Current Estimated Value
Home Financials for this Owner
Home Financials are based on the most recent Mortgage that was taken out on this home.
Original Mortgage
$127,687
Outstanding Balance
$85,702
Interest Rate
5%
Mortgage Type
VA
Estimated Equity
$242,684
Purchase Details
Closed on
Jan 5, 2010
Sold by
Rodney Malissa
Bought by
Homebanc Mortgage Trust 2006 & 2
Purchase Details
Closed on
Jun 22, 2006
Sold by
Avenue Homes Inc
Bought by
Rodney Malissa
Home Financials for this Owner
Home Financials are based on the most recent Mortgage that was taken out on this home.
Original Mortgage
$167,000
Interest Rate
8.12%
Mortgage Type
New Conventional
Purchase Details
Closed on
Dec 23, 2004
Sold by
Belans Properties Inc
Purchase Details
Closed on
Dec 22, 2004
Sold by
Jabec Properties Inc
Purchase Details
Closed on
Apr 23, 2004
Sold by
Larry Hunter Development Co
Create a Home Valuation Report for This Property
The Home Valuation Report is an in-depth analysis detailing your home's value as well as a comparison with similar homes in the area
Home Values in the Area
Average Home Value in this Area
Purchase History
| Date | Buyer | Sale Price | Title Company |
|---|---|---|---|
| Bowers Ian R | -- | -- | |
| Bowers Ian R | $125,000 | -- | |
| Homebanc Mortgage Trust 2006 & 2 | $177,131 | -- | |
| Rodney Malissa | $167,000 | -- | |
| -- | $167,000 | -- | |
| -- | $44,500 | -- | |
| -- | $39,200 | -- | |
| -- | $39,100 | -- |
Source: Public Records
Mortgage History
| Date | Status | Borrower | Loan Amount |
|---|---|---|---|
| Open | Bowers Ian R | $127,687 | |
| Previous Owner | -- | $167,000 |
Source: Public Records
Tax History Compared to Growth
Tax History
| Year | Tax Paid | Tax Assessment Tax Assessment Total Assessment is a certain percentage of the fair market value that is determined by local assessors to be the total taxable value of land and additions on the property. | Land | Improvement |
|---|---|---|---|---|
| 2024 | $3,124 | $125,600 | $12,000 | $113,600 |
| 2023 | $3,298 | $126,520 | $12,000 | $114,520 |
| 2022 | $2,443 | $93,720 | $12,000 | $81,720 |
| 2021 | $2,398 | $82,520 | $8,000 | $74,520 |
| 2020 | $2,212 | $74,480 | $8,000 | $66,480 |
| 2019 | $2,085 | $69,200 | $8,000 | $61,200 |
| 2016 | $1,726 | $57,080 | $8,000 | $49,080 |
Source: Public Records
Map
Nearby Homes
- 241 Polo Crossing
- 201 Polo Crossing
- 109 Derby Dr
- 30 Derby Dr
- 263 Polo Crossing Unit /35
- 263 Polo Crossing
- 46 Derby Dr
- 0 Derby Dr Unit 8169529
- 244 Polo Crossing
- 194 Champion Way
- 165 Polo Crossing
- 268 Polo Crossing
- 167 Champion Way
- 174 Champion Way
- 957 Waters Rd
- 291 Polo Crossing
- 172 Polo Crossing
- 129 Polo Crossing
- 290 Polo Crossing Unit 38
- 290 Polo Crossing