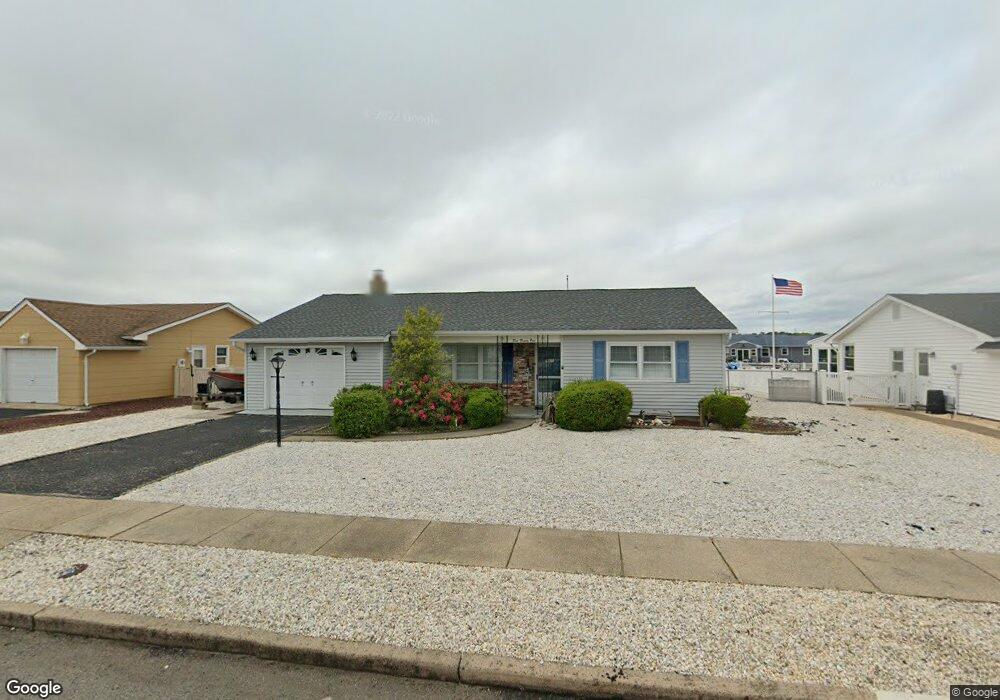
221 Rahway Rd Barnegat, NJ 08005
Barnegat Township NeighborhoodEstimated Value: $541,000 - $591,000
2
Beds
1
Bath
1,134
Sq Ft
$507/Sq Ft
Est. Value
About This Home
This home is located at 221 Rahway Rd, Barnegat, NJ 08005 and is currently estimated at $574,540, approximately $506 per square foot. 221 Rahway Rd is a home located in Ocean County with nearby schools including Barnegat High School.
Ownership History
Date
Name
Owned For
Owner Type
Purchase Details
Closed on
Apr 12, 2001
Sold by
Grub Eric
Bought by
Lagreca Thoms and La Greca Linda
Current Estimated Value
Home Financials for this Owner
Home Financials are based on the most recent Mortgage that was taken out on this home.
Original Mortgage
$79,000
Outstanding Balance
$28,862
Interest Rate
6.9%
Estimated Equity
$545,678
Create a Home Valuation Report for This Property
The Home Valuation Report is an in-depth analysis detailing your home's value as well as a comparison with similar homes in the area
Home Values in the Area
Average Home Value in this Area
Purchase History
| Date | Buyer | Sale Price | Title Company |
|---|---|---|---|
| Lagreca Thoms | $179,000 | -- | |
| Lagreca Thoms | $179,000 | -- |
Source: Public Records
Mortgage History
| Date | Status | Borrower | Loan Amount |
|---|---|---|---|
| Open | Lagreca Thoms | $79,000 | |
| Closed | Lagreca Thoms | $79,000 |
Source: Public Records
Tax History Compared to Growth
Tax History
| Year | Tax Paid | Tax Assessment Tax Assessment Total Assessment is a certain percentage of the fair market value that is determined by local assessors to be the total taxable value of land and additions on the property. | Land | Improvement |
|---|---|---|---|---|
| 2025 | $10,494 | $352,500 | $250,000 | $102,500 |
| 2024 | $10,261 | $352,500 | $250,000 | $102,500 |
| 2023 | $9,930 | $352,500 | $250,000 | $102,500 |
| 2022 | $9,930 | $352,500 | $250,000 | $102,500 |
| 2021 | $9,884 | $352,500 | $250,000 | $102,500 |
| 2020 | $9,838 | $352,500 | $250,000 | $102,500 |
| 2019 | $9,694 | $352,500 | $250,000 | $102,500 |
| 2018 | $9,620 | $352,500 | $250,000 | $102,500 |
| 2017 | $9,461 | $352,500 | $250,000 | $102,500 |
| 2016 | $9,267 | $352,500 | $250,000 | $102,500 |
| 2015 | $8,975 | $352,500 | $250,000 | $102,500 |
| 2014 | $8,746 | $352,500 | $250,000 | $102,500 |
Source: Public Records
Map
Nearby Homes
- 23 Mediterranean Ct Unit 43D
- 27 Gibraltar Ct
- 379 Bayshore Dr
- 25 S Seas Ct
- 389 Bay Shore Dr Unit 3
- 389 Bayshore Dr
- 100 Cedar Ln
- 401 Bayshore Dr Unit 2A
- 401 Bay Shore Dr Unit 8B
- 34A Denville St
- 168 Beverly Dr
- 34 Denville St Unit A
- 23 Pomona Dr
- 148 Bayshore Dr Unit A
- 107 6th St
- 6 Roxbury Dr
- 441 E Bay Ave Unit 9
- 6 Reno Ct
- 301 6th St