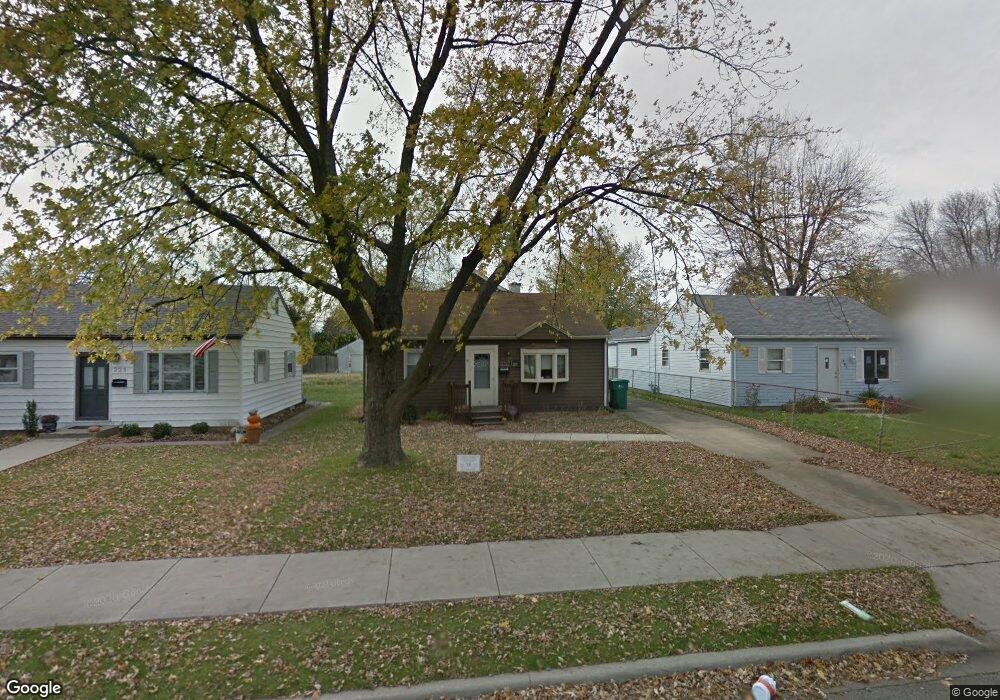
221 S May St Joliet, IL 60436
Reedwood NeighborhoodEstimated Value: $258,024 - $288,000
3
Beds
1
Bath
1,662
Sq Ft
$165/Sq Ft
Est. Value
About This Home
This home is located at 221 S May St, Joliet, IL 60436 and is currently estimated at $274,756, approximately $165 per square foot. 221 S May St is a home located in Will County with nearby schools including Lynne Thigpen Elementary School, Dirksen Junior High School, and Joliet Central High School.
Ownership History
Date
Name
Owned For
Owner Type
Purchase Details
Closed on
Apr 28, 2004
Sold by
Gower Daniel
Bought by
Gower Daniel and Gower Debra S
Current Estimated Value
Home Financials for this Owner
Home Financials are based on the most recent Mortgage that was taken out on this home.
Original Mortgage
$142,150
Outstanding Balance
$68,937
Interest Rate
5.99%
Mortgage Type
FHA
Estimated Equity
$205,819
Purchase Details
Closed on
Apr 30, 2001
Sold by
Johnson Victor K and Johnson Marla J
Bought by
Cherry Glenn L and Cherry Pamela
Home Financials for this Owner
Home Financials are based on the most recent Mortgage that was taken out on this home.
Original Mortgage
$65,000
Interest Rate
6.95%
Create a Home Valuation Report for This Property
The Home Valuation Report is an in-depth analysis detailing your home's value as well as a comparison with similar homes in the area
Home Values in the Area
Average Home Value in this Area
Purchase History
| Date | Buyer | Sale Price | Title Company |
|---|---|---|---|
| Gower Daniel | -- | -- | |
| Gower Daniel | $144,500 | Multiple | |
| Cherry Glenn L | $58,500 | First American Title |
Source: Public Records
Mortgage History
| Date | Status | Borrower | Loan Amount |
|---|---|---|---|
| Open | Gower Daniel | $142,150 | |
| Previous Owner | Cherry Glenn L | $65,000 |
Source: Public Records
Tax History Compared to Growth
Tax History
| Year | Tax Paid | Tax Assessment Tax Assessment Total Assessment is a certain percentage of the fair market value that is determined by local assessors to be the total taxable value of land and additions on the property. | Land | Improvement |
|---|---|---|---|---|
| 2024 | $3,439 | $80,044 | $12,741 | $67,303 |
| 2023 | $3,439 | $71,118 | $11,320 | $59,798 |
| 2022 | $4,254 | $64,331 | $10,240 | $54,091 |
| 2021 | $4,613 | $60,083 | $9,564 | $50,519 |
| 2020 | $4,324 | $57,059 | $9,083 | $47,976 |
| 2019 | $4,039 | $53,028 | $8,441 | $44,587 |
| 2018 | $3,642 | $47,546 | $7,554 | $39,992 |
| 2017 | $3,329 | $43,228 | $6,868 | $36,360 |
| 2016 | $3,627 | $39,744 | $6,299 | $33,445 |
| 2015 | $3,293 | $35,850 | $5,950 | $29,900 |
| 2014 | $3,293 | $35,650 | $5,900 | $29,750 |
| 2013 | $3,293 | $36,648 | $6,583 | $30,065 |
Source: Public Records
Map
Nearby Homes