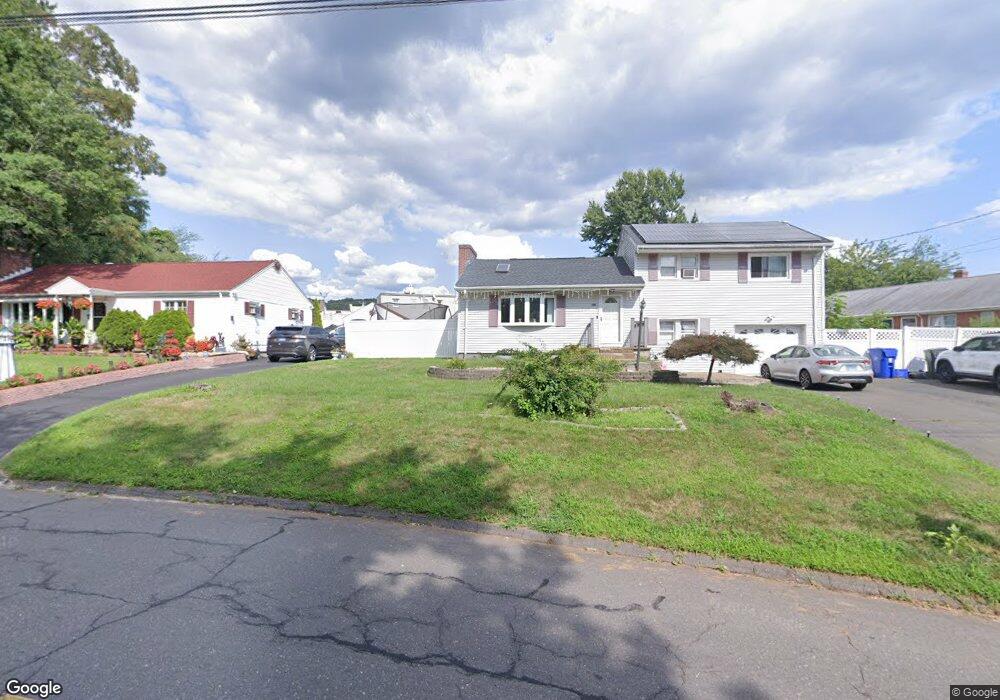
221 Superior Ave Newington, CT 06111
Estimated Value: $361,000 - $386,000
3
Beds
1
Bath
1,308
Sq Ft
$283/Sq Ft
Est. Value
About This Home
This home is located at 221 Superior Ave, Newington, CT 06111 and is currently estimated at $369,616, approximately $282 per square foot. 221 Superior Ave is a home located in Hartford County with nearby schools including Ruth Chaffee School, John Wallace Middle School, and Newington High School.
Ownership History
Date
Name
Owned For
Owner Type
Purchase Details
Closed on
Feb 24, 2006
Sold by
Skenderidis Anestis and Skenderidis Jacqueline M
Bought by
Cespedes Jorge and Cespedes Angel
Current Estimated Value
Home Financials for this Owner
Home Financials are based on the most recent Mortgage that was taken out on this home.
Original Mortgage
$215,920
Outstanding Balance
$117,154
Interest Rate
6.7%
Estimated Equity
$252,462
Purchase Details
Closed on
Apr 20, 1995
Sold by
Htfd Firefighters Fcu
Bought by
Skenderidis Anestis and Skenderidis Jacqueline
Home Financials for this Owner
Home Financials are based on the most recent Mortgage that was taken out on this home.
Original Mortgage
$100,800
Interest Rate
8.55%
Mortgage Type
Unknown
Create a Home Valuation Report for This Property
The Home Valuation Report is an in-depth analysis detailing your home's value as well as a comparison with similar homes in the area
Home Values in the Area
Average Home Value in this Area
Purchase History
| Date | Buyer | Sale Price | Title Company |
|---|---|---|---|
| Cespedes Jorge | $269,900 | -- | |
| Skenderidis Anestis | $112,000 | -- |
Source: Public Records
Mortgage History
| Date | Status | Borrower | Loan Amount |
|---|---|---|---|
| Open | Skenderidis Anestis | $215,920 | |
| Closed | Skenderidis Anestis | $53,980 | |
| Previous Owner | Skenderidis Anestis | $94,703 | |
| Previous Owner | Skenderidis Anestis | $100,800 |
Source: Public Records
Tax History Compared to Growth
Tax History
| Year | Tax Paid | Tax Assessment Tax Assessment Total Assessment is a certain percentage of the fair market value that is determined by local assessors to be the total taxable value of land and additions on the property. | Land | Improvement |
|---|---|---|---|---|
| 2025 | $5,925 | $148,200 | $54,020 | $94,180 |
| 2024 | $5,608 | $141,370 | $54,020 | $87,350 |
| 2023 | $5,423 | $141,370 | $54,020 | $87,350 |
| 2022 | $5,441 | $141,370 | $54,020 | $87,350 |
| 2021 | $5,487 | $141,370 | $54,020 | $87,350 |
| 2020 | $5,503 | $140,100 | $54,020 | $86,080 |
| 2019 | $5,527 | $140,100 | $54,020 | $86,080 |
| 2018 | $5,394 | $140,100 | $54,020 | $86,080 |
| 2017 | $5,126 | $140,100 | $54,020 | $86,080 |
| 2016 | $5,009 | $140,100 | $54,020 | $86,080 |
| 2014 | $4,719 | $135,730 | $54,650 | $81,080 |
Source: Public Records
Map
Nearby Homes
- 92 Timothy St
- 98 Crown Ridge
- 64 Kenlock St
- 122 Cottonwood Rd Unit 122
- 265 Back Ln
- 155 Cottonwood Rd
- 15 Woodsedge Dr Unit 6C
- 15 Woodsedge Dr Unit 4B
- 35 Woodsedge Dr Unit 4C
- 61 Luca Ln
- 76 Luca Lane Homesite 8
- 8 Stella Dr
- 67 Luca (Homesite 6) Ln
- 53 Luca (Homesite 4) Ln
- 91 Centerwood Rd
- 274 Cedarwood Ln
- 133 Robbins Ave
- 129 Glenview Dr
- 263 Two Rod Hwy
- 120 Fox Run Ct
- 217 Superior Ave Unit B
- 225 Superior Ave
- 2525 Berlin Turnpike
- 229 Superior Ave
- 220 Superior Ave
- 201 School House Rd
- 2543 Berlin Turnpike Unit rear
- 2547 Berlin Turnpike
- 210 Superior Ave
- 240 Superior Ave
- 195 School House Rd
- 109 Timothy St
- 196 Superior Ave
- 110 Timothy St
- 193 Superior Ave
- 189 School House Rd
- 103 Timothy St
- 2516 Berlin Turnpike
- 19 Gail Cir
- 196 School House Rd