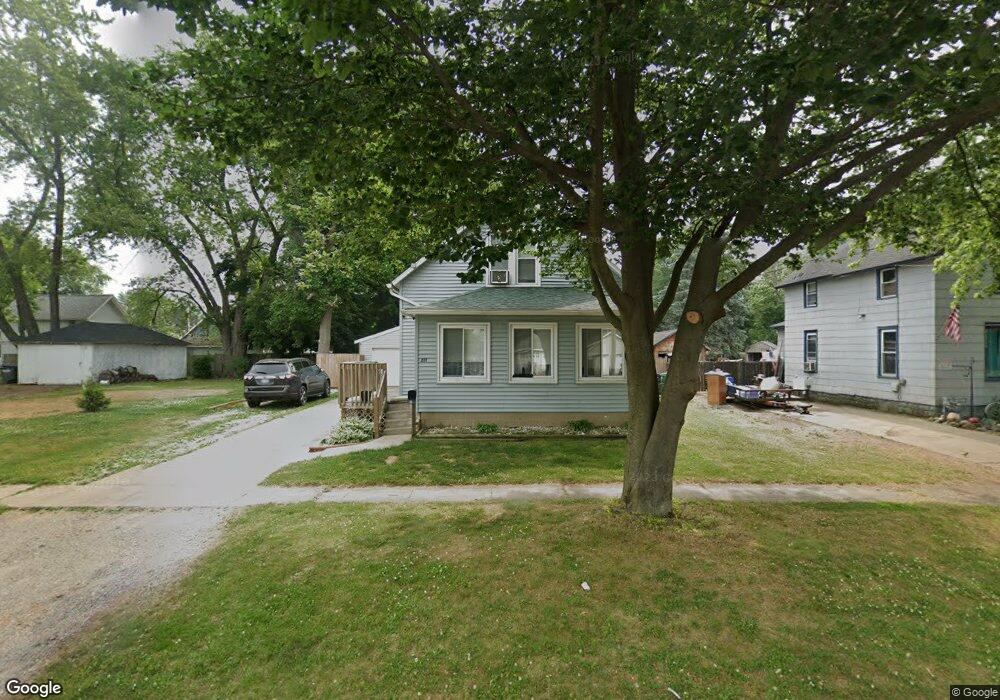
221 Susan St Sturgis, MI 49091
Estimated Value: $119,000 - $141,759
3
Beds
1
Bath
1,283
Sq Ft
$101/Sq Ft
Est. Value
About This Home
This home is located at 221 Susan St, Sturgis, MI 49091 and is currently estimated at $129,440, approximately $100 per square foot. 221 Susan St is a home located in St. Joseph County with nearby schools including Sturgis High School, Trinity Lutheran School, and St John's Lutheran School.
Ownership History
Date
Name
Owned For
Owner Type
Purchase Details
Closed on
Apr 15, 2024
Sold by
Martinez Miguel A and Martinez Heather M
Bought by
Martinez Jose L
Current Estimated Value
Home Financials for this Owner
Home Financials are based on the most recent Mortgage that was taken out on this home.
Original Mortgage
$95,959
Outstanding Balance
$94,541
Interest Rate
6.94%
Mortgage Type
New Conventional
Estimated Equity
$34,899
Purchase Details
Closed on
Apr 15, 2002
Sold by
Bankers Trust Co Of California
Bought by
Martinez Miguel A and Martinez Heather M
Purchase Details
Closed on
Apr 2, 2002
Sold by
Long Beach Mortgage Co
Bought by
Bankers Trust Co Of California
Purchase Details
Closed on
May 3, 2001
Sold by
Ultz Wayne E
Bought by
Long Beach Mortgage Co
Purchase Details
Closed on
Feb 15, 2000
Sold by
United Companies Lending Corp
Bought by
Ultz Wayne E
Purchase Details
Closed on
Dec 16, 1999
Sold by
Ultz Wayne E
Bought by
United Companies Lending Corp
Purchase Details
Closed on
Jan 1, 1901
Create a Home Valuation Report for This Property
The Home Valuation Report is an in-depth analysis detailing your home's value as well as a comparison with similar homes in the area
Home Values in the Area
Average Home Value in this Area
Purchase History
| Date | Buyer | Sale Price | Title Company |
|---|---|---|---|
| Martinez Jose L | $95,000 | None Listed On Document | |
| Martinez Miguel A | $39,900 | -- | |
| Bankers Trust Co Of California | -- | -- | |
| Long Beach Mortgage Co | -- | -- | |
| Ultz Wayne E | -- | -- | |
| United Companies Lending Corp | $52,400 | -- | |
| -- | -- | -- |
Source: Public Records
Mortgage History
| Date | Status | Borrower | Loan Amount |
|---|---|---|---|
| Open | Martinez Jose L | $95,959 |
Source: Public Records
Tax History Compared to Growth
Tax History
| Year | Tax Paid | Tax Assessment Tax Assessment Total Assessment is a certain percentage of the fair market value that is determined by local assessors to be the total taxable value of land and additions on the property. | Land | Improvement |
|---|---|---|---|---|
| 2025 | $1,269 | $58,100 | $5,100 | $53,000 |
| 2024 | $1,055 | $52,700 | $4,500 | $48,200 |
| 2023 | $1,505 | $44,400 | $4,500 | $39,900 |
| 2022 | $1,401 | $37,900 | $4,200 | $33,700 |
| 2021 | $1,575 | $33,500 | $4,100 | $29,400 |
| 2020 | $1,557 | $30,000 | $3,300 | $26,700 |
| 2019 | $1,528 | $26,400 | $3,900 | $22,500 |
| 2018 | $1,412 | $24,900 | $4,300 | $20,600 |
| 2017 | $1,382 | $25,700 | $25,700 | $0 |
| 2016 | -- | $24,000 | $24,000 | $0 |
| 2015 | -- | $23,000 | $0 | $0 |
| 2014 | -- | $22,400 | $22,400 | $0 |
| 2012 | -- | $21,900 | $21,900 | $0 |
Source: Public Records
Map
Nearby Homes
- 605 E West St
- 105 Jean St
- 404 Susan Ave
- 405 Jean St
- 602 Jean Ave
- 402 N 4th St
- 707 E Jerolene St
- 218 Michigan Ave
- 219 S Lakeview St
- 502 E Jerolene St
- 0 Vl Farwell Ave
- 302 E Electric Ct
- 416 Sturgis St
- 610 N Prospect St
- 300 Maplecrest Ave
- 612 N Prospect St
- 607 N Nottawa St
- 701 N Nottawa St
- 405 Michigan Ave
- 607 George St