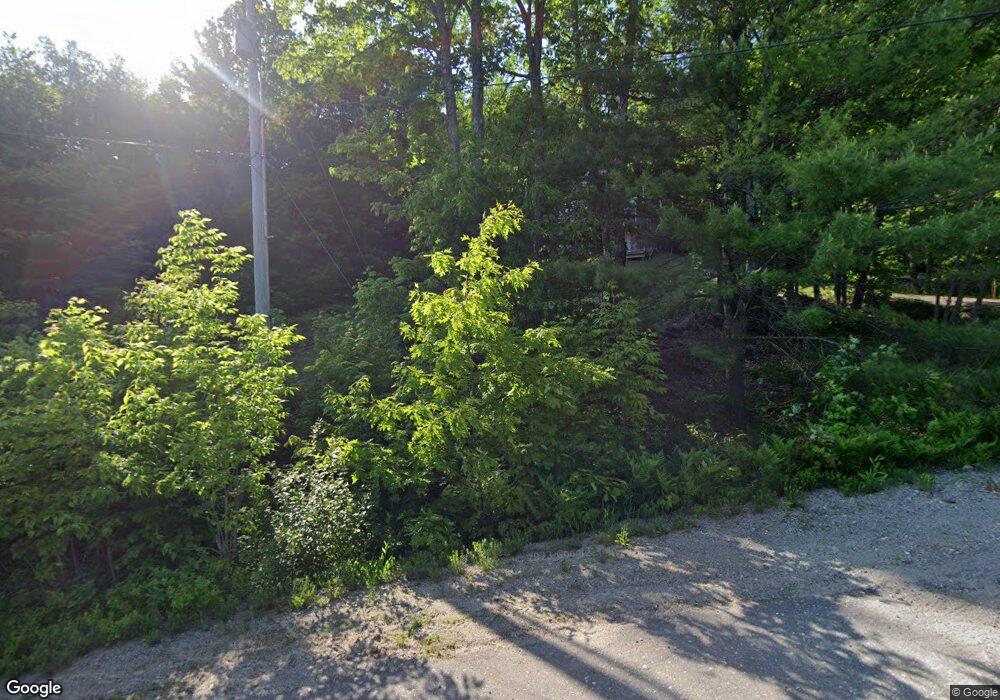
221 Tessier Rd Canton, ME 04221
Estimated Value: $220,000 - $296,770
--
Bed
--
Bath
768
Sq Ft
$340/Sq Ft
Est. Value
About This Home
This home is located at 221 Tessier Rd, Canton, ME 04221 and is currently estimated at $261,257, approximately $340 per square foot. 221 Tessier Rd is a home.
Ownership History
Date
Name
Owned For
Owner Type
Purchase Details
Closed on
Sep 6, 2024
Sold by
Couture Ryan
Bought by
Couture Ryan and Couture Jayde
Current Estimated Value
Home Financials for this Owner
Home Financials are based on the most recent Mortgage that was taken out on this home.
Original Mortgage
$187,200
Outstanding Balance
$185,197
Interest Rate
6.73%
Mortgage Type
Purchase Money Mortgage
Estimated Equity
$76,060
Purchase Details
Closed on
Apr 11, 2016
Sold by
Castonguay Real
Bought by
Couture Ryan
Home Financials for this Owner
Home Financials are based on the most recent Mortgage that was taken out on this home.
Original Mortgage
$116,844
Interest Rate
3.62%
Mortgage Type
Unknown
Create a Home Valuation Report for This Property
The Home Valuation Report is an in-depth analysis detailing your home's value as well as a comparison with similar homes in the area
Home Values in the Area
Average Home Value in this Area
Purchase History
| Date | Buyer | Sale Price | Title Company |
|---|---|---|---|
| Couture Ryan | -- | None Available | |
| Couture Ryan | -- | None Available | |
| Couture Ryan | -- | -- |
Source: Public Records
Mortgage History
| Date | Status | Borrower | Loan Amount |
|---|---|---|---|
| Open | Couture Ryan | $187,200 | |
| Closed | Couture Ryan | $187,200 | |
| Previous Owner | Couture Ryan | $116,844 |
Source: Public Records
Tax History Compared to Growth
Tax History
| Year | Tax Paid | Tax Assessment Tax Assessment Total Assessment is a certain percentage of the fair market value that is determined by local assessors to be the total taxable value of land and additions on the property. | Land | Improvement |
|---|---|---|---|---|
| 2024 | $2,357 | $113,570 | $27,500 | $86,070 |
| 2023 | $2,186 | $113,570 | $27,500 | $86,070 |
| 2022 | $2,016 | $113,570 | $27,500 | $86,070 |
| 2021 | $1,987 | $113,570 | $27,500 | $86,070 |
| 2020 | $1,987 | $113,570 | $27,500 | $86,070 |
| 2019 | $1,987 | $113,570 | $27,500 | $86,070 |
| 2018 | $1,668 | $95,328 | $26,500 | $68,828 |
| 2017 | $1,892 | $95,328 | $26,500 | $68,828 |
| 2016 | $1,907 | $95,328 | $26,500 | $68,828 |
| 2015 | $1,978 | $95,328 | $26,500 | $68,828 |
| 2013 | $2,021 | $95,328 | $26,500 | $68,828 |
Source: Public Records
Map
Nearby Homes