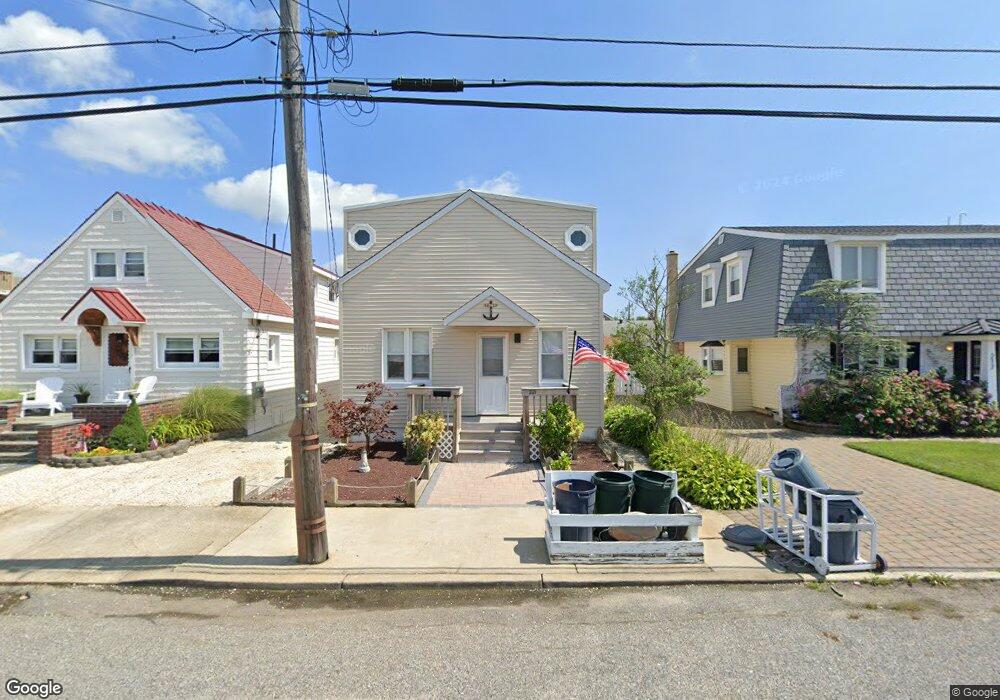
221 W 17th St Ship Bottom, NJ 08008
Long Beach Island NeighborhoodEstimated Value: $814,000 - $1,256,000
4
Beds
2
Baths
1,556
Sq Ft
$674/Sq Ft
Est. Value
About This Home
This home is located at 221 W 17th St, Ship Bottom, NJ 08008 and is currently estimated at $1,049,379, approximately $674 per square foot. 221 W 17th St is a home located in Ocean County with nearby schools including Ethel A. Jacobsen Elementary School, Long Beach Island Grade School, and Southern Regional Middle School.
Ownership History
Date
Name
Owned For
Owner Type
Purchase Details
Closed on
May 4, 2001
Sold by
Young Thomas
Bought by
Sokolowski Jeffrey and Sokolowski Candice
Current Estimated Value
Home Financials for this Owner
Home Financials are based on the most recent Mortgage that was taken out on this home.
Original Mortgage
$109,500
Outstanding Balance
$40,887
Interest Rate
7.03%
Estimated Equity
$1,008,492
Purchase Details
Closed on
Dec 17, 1998
Sold by
Cerino William G and Cerino Donna B
Bought by
Young Thomas and Young Gail
Home Financials for this Owner
Home Financials are based on the most recent Mortgage that was taken out on this home.
Original Mortgage
$166,400
Interest Rate
6.89%
Create a Home Valuation Report for This Property
The Home Valuation Report is an in-depth analysis detailing your home's value as well as a comparison with similar homes in the area
Home Values in the Area
Average Home Value in this Area
Purchase History
| Date | Buyer | Sale Price | Title Company |
|---|---|---|---|
| Sokolowski Jeffrey | $260,000 | -- | |
| Sokolowski Jeffrey | $260,000 | -- | |
| Young Thomas | $184,900 | -- |
Source: Public Records
Mortgage History
| Date | Status | Borrower | Loan Amount |
|---|---|---|---|
| Open | Sokolowski Jeffrey | $109,500 | |
| Closed | Sokolowski Jeffrey | $109,500 | |
| Previous Owner | Young Thomas | $166,400 |
Source: Public Records
Tax History Compared to Growth
Tax History
| Year | Tax Paid | Tax Assessment Tax Assessment Total Assessment is a certain percentage of the fair market value that is determined by local assessors to be the total taxable value of land and additions on the property. | Land | Improvement |
|---|---|---|---|---|
| 2025 | $4,949 | $410,700 | $250,100 | $160,600 |
| 2024 | $4,719 | $410,700 | $250,100 | $160,600 |
| 2023 | $4,349 | $410,700 | $250,100 | $160,600 |
| 2022 | $4,349 | $410,700 | $250,100 | $160,600 |
| 2021 | $4,329 | $410,700 | $250,100 | $160,600 |
| 2020 | $4,341 | $410,700 | $250,100 | $160,600 |
| 2019 | $4,345 | $410,700 | $250,100 | $160,600 |
| 2018 | $4,353 | $410,700 | $250,100 | $160,600 |
| 2017 | $4,070 | $410,700 | $250,100 | $160,600 |
| 2016 | $3,805 | $343,700 | $207,000 | $136,700 |
| 2015 | $3,712 | $343,700 | $207,000 | $136,700 |
| 2014 | $3,709 | $343,700 | $207,000 | $136,700 |
Source: Public Records
Map
Nearby Homes
- 111 W 18th St Unit 2
- 1810 Central Ave Unit 15
- 1810 Central Ave Unit 17
- 1903 Pennsylvania Ave
- 1306 Barnegat Ave
- 2109 Central Ave
- 1219 Long Beach Blvd
- 108 W 10th St
- 1001 Ocean Ave Unit 1017
- 1001 Ocean Ave Unit 1012
- 1001 Ocean Ave Unit C1001
- 109 W 26th St
- 615 Barnegat Ave
- 379 W 8th St Unit 6
- 605 Long Beach Blvd
- 401 Boulevard Unit 306
- 401 Boulevard Unit 506
- 401 Boulevard Unit 508
- 401 Boulevard Unit 503
- 401 Boulevard Unit 201