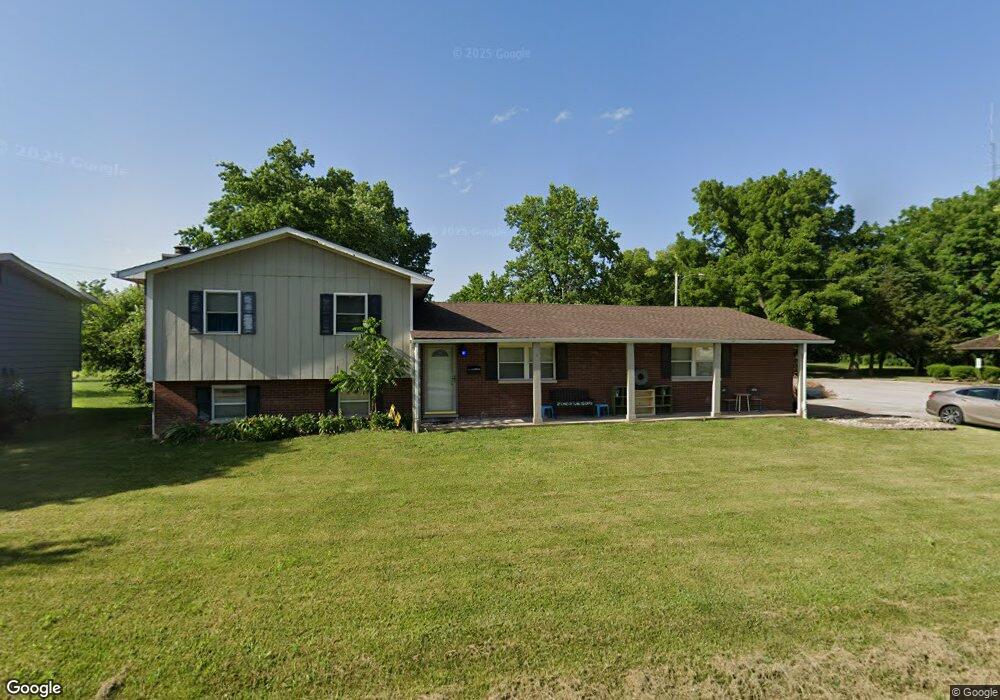
221 W 2nd St East Saint Louis, IL 62206
Estimated Value: $69,718 - $104,000
--
Bed
--
Bath
546
Sq Ft
$154/Sq Ft
Est. Value
About This Home
This home is located at 221 W 2nd St, East Saint Louis, IL 62206 and is currently estimated at $83,930, approximately $153 per square foot. 221 W 2nd St is a home located in St. Clair County.
Ownership History
Date
Name
Owned For
Owner Type
Purchase Details
Closed on
Feb 10, 2021
Sold by
Cernich Daniel J and Cernich Laura A
Bought by
Allen Angela
Current Estimated Value
Purchase Details
Closed on
Jun 27, 2016
Sold by
Gateway North Redevelopment Group Llc
Bought by
Cernich Daniel J and Cernich Laura A
Purchase Details
Closed on
Jul 29, 2013
Sold by
Rv Holdings Three Llc
Bought by
Gateway North Redevelopment Group Llc
Purchase Details
Closed on
Apr 19, 2013
Sold by
The Bank Of New York Mellon
Bought by
Rv Holdings Three Llc
Purchase Details
Closed on
Dec 4, 2012
Sold by
Ortega Raymond E and Case #12 Ch 72
Bought by
The Bank Of New York Mellon and The Bank Of New York
Purchase Details
Closed on
May 11, 2004
Sold by
Union Planters Bank Na
Bought by
Ortega Raymond E
Home Financials for this Owner
Home Financials are based on the most recent Mortgage that was taken out on this home.
Original Mortgage
$64,125
Interest Rate
9.01%
Mortgage Type
Purchase Money Mortgage
Purchase Details
Closed on
Feb 26, 2004
Sold by
Fields Jeffrey S and Fields Julie K
Bought by
Union Planters Bank Na
Create a Home Valuation Report for This Property
The Home Valuation Report is an in-depth analysis detailing your home's value as well as a comparison with similar homes in the area
Home Values in the Area
Average Home Value in this Area
Purchase History
| Date | Buyer | Sale Price | Title Company |
|---|---|---|---|
| Allen Angela | $57,000 | Town & Country Title | |
| Cernich Daniel J | $39,000 | Metro Title & Escrow Co | |
| Gateway North Redevelopment Group Llc | $26,000 | Atg | |
| Rv Holdings Three Llc | $15,000 | First American | |
| The Bank Of New York Mellon | -- | None Available | |
| Ortega Raymond E | $67,500 | Mctc | |
| Union Planters Bank Na | -- | -- |
Source: Public Records
Mortgage History
| Date | Status | Borrower | Loan Amount |
|---|---|---|---|
| Previous Owner | Ortega Raymond E | $64,125 |
Source: Public Records
Tax History Compared to Growth
Tax History
| Year | Tax Paid | Tax Assessment Tax Assessment Total Assessment is a certain percentage of the fair market value that is determined by local assessors to be the total taxable value of land and additions on the property. | Land | Improvement |
|---|---|---|---|---|
| 2024 | $2,107 | $17,077 | $1,697 | $15,380 |
| 2023 | $1,793 | $15,435 | $1,534 | $13,901 |
| 2022 | $1,494 | $13,527 | $1,344 | $12,183 |
| 2021 | $2,753 | $12,819 | $1,274 | $11,545 |
| 2020 | $3,044 | $13,065 | $1,335 | $11,730 |
| 2019 | $3,049 | $13,065 | $1,335 | $11,730 |
| 2018 | $3,035 | $13,256 | $1,355 | $11,901 |
| 2017 | $1,433 | $12,936 | $1,322 | $11,614 |
| 2016 | $2,311 | $9,420 | $1,316 | $8,104 |
| 2014 | $1,905 | $9,318 | $1,302 | $8,016 |
| 2013 | $3,625 | $8,740 | $1,221 | $7,519 |
Source: Public Records
Map
Nearby Homes
- 225 W 2nd St
- 221 Main St
- 229 W 4th St
- 18 Denovion Ct
- 17 Denovion Ct
- 209 W 6th St
- 600 Plum St
- 310 E 5th St
- 111 Saint Leo Dr
- 125 Saint Leo Dr
- 805 Plum St
- 120 Saint Leo Dr
- 525 Saint Leo Dr
- 603 Saint Nicholas Dr
- 725 Saint Nicholas Dr
- 803 Saint Thomas Ln
- 804 Saint Thomas Ln
- 808 Saint Thomas Ln
- 810 Saint Thomas Ln
- 510 Saint Paul Dr