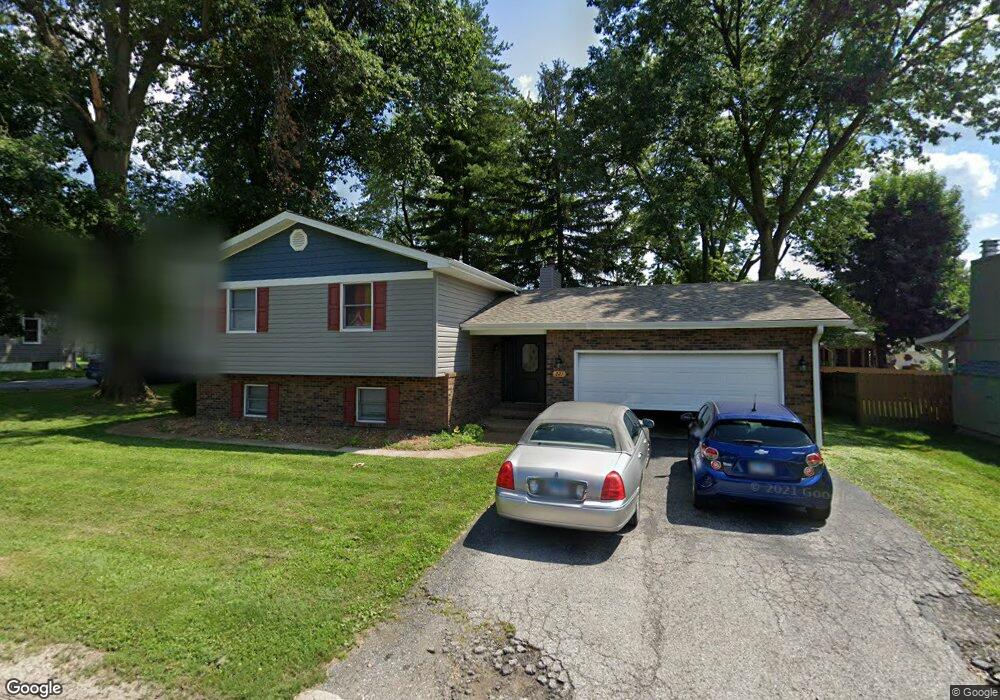
221 W Zupan St Maryville, IL 62062
Estimated Value: $232,000 - $363,000
5
Beds
2
Baths
1,300
Sq Ft
$209/Sq Ft
Est. Value
About This Home
This home is located at 221 W Zupan St, Maryville, IL 62062 and is currently estimated at $271,643, approximately $208 per square foot. 221 W Zupan St is a home located in Madison County with nearby schools including Maryville Elementary School, Dorris Intermediate School, and Collinsville Middle School.
Ownership History
Date
Name
Owned For
Owner Type
Purchase Details
Closed on
Nov 11, 2019
Sold by
Ulloa Daniel E and Ulloa Calixto
Bought by
Hansen Allison G and Ngoma Omba T
Current Estimated Value
Home Financials for this Owner
Home Financials are based on the most recent Mortgage that was taken out on this home.
Original Mortgage
$120,164
Outstanding Balance
$93,847
Interest Rate
3.75%
Mortgage Type
Adjustable Rate Mortgage/ARM
Estimated Equity
$177,796
Purchase Details
Closed on
Mar 30, 2010
Sold by
Kessmann Nancy K
Bought by
Ulloa Daniel E and Ulloa Calixto
Home Financials for this Owner
Home Financials are based on the most recent Mortgage that was taken out on this home.
Original Mortgage
$137,464
Interest Rate
5.5%
Mortgage Type
FHA
Create a Home Valuation Report for This Property
The Home Valuation Report is an in-depth analysis detailing your home's value as well as a comparison with similar homes in the area
Home Values in the Area
Average Home Value in this Area
Purchase History
| Date | Buyer | Sale Price | Title Company |
|---|---|---|---|
| Hansen Allison G | $150,500 | Abstracts & Titles | |
| Ulloa Daniel E | $140,000 | Abstracts & Titles Inc |
Source: Public Records
Mortgage History
| Date | Status | Borrower | Loan Amount |
|---|---|---|---|
| Open | Hansen Allison G | $120,164 | |
| Previous Owner | Ulloa Daniel E | $137,464 |
Source: Public Records
Tax History Compared to Growth
Tax History
| Year | Tax Paid | Tax Assessment Tax Assessment Total Assessment is a certain percentage of the fair market value that is determined by local assessors to be the total taxable value of land and additions on the property. | Land | Improvement |
|---|---|---|---|---|
| 2024 | $4,433 | $67,710 | $7,500 | $60,210 |
| 2023 | $4,433 | $62,160 | $6,820 | $55,340 |
| 2022 | $4,149 | $57,480 | $6,310 | $51,170 |
| 2021 | $3,758 | $54,000 | $5,930 | $48,070 |
| 2020 | $3,631 | $51,520 | $5,660 | $45,860 |
| 2019 | $3,527 | $55,670 | $5,470 | $50,200 |
| 2018 | $3,434 | $52,740 | $5,180 | $47,560 |
| 2017 | $3,356 | $51,690 | $5,080 | $46,610 |
| 2016 | $3,411 | $51,690 | $5,080 | $46,610 |
| 2015 | $3,242 | $50,350 | $4,950 | $45,400 |
| 2014 | $3,242 | $50,350 | $4,950 | $45,400 |
| 2013 | $3,242 | $50,350 | $4,950 | $45,400 |
Source: Public Records
Map
Nearby Homes
- 137 W Zupan St
- 501 Drost St
- 201 S Lange Ave
- 419 N Donk Ave
- 1005 Daniel Dr
- 1014 Daniel Dr
- 1029 Andra Dr
- 912 Oakridge Dr
- 1313 Jacquelyn Ct
- 130 Hilltop Place
- 29 Dogwood Terrace
- 1 Heather Green
- 226 Woodridge Ct
- 6020 Keebler Oaks Dr
- 22 Oak Valley Dr
- 1831 Crimson Oak Dr
- 1844 Crimson Oak Dr
- 53 Cheshire Dr
- 1819 Robin Mills Ct
- 2301 Preswyck Ct