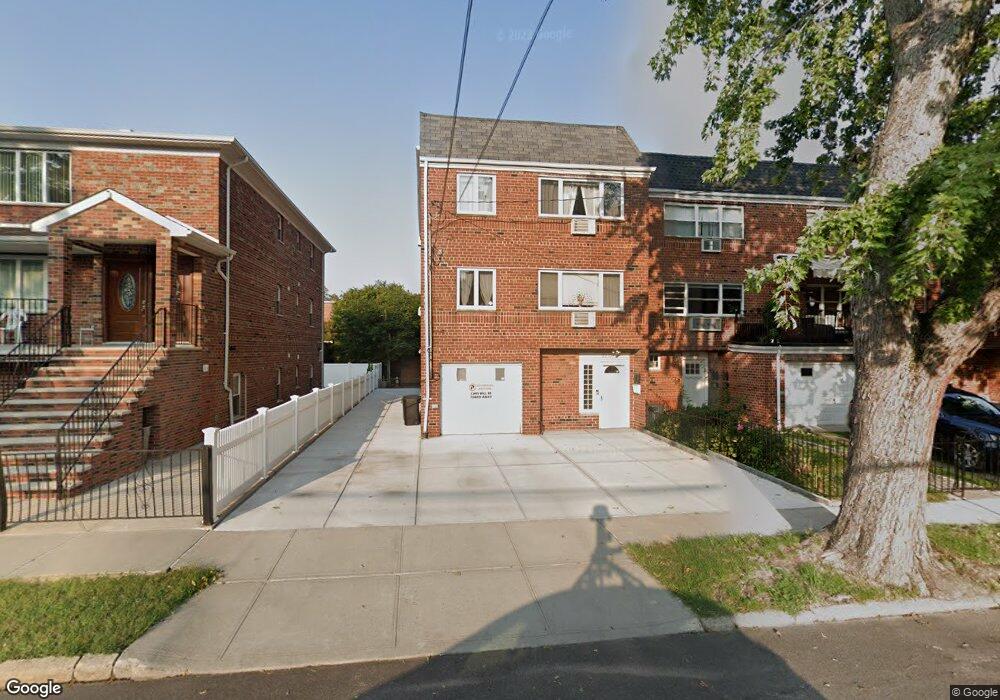
2210 73rd St East Elmhurst, NY 11370
Ditmars Steinway NeighborhoodEstimated Value: $1,599,000 - $1,852,000
2
Beds
1
Bath
925
Sq Ft
$1,865/Sq Ft
Est. Value
About This Home
This home is located at 2210 73rd St, East Elmhurst, NY 11370 and is currently estimated at $1,725,000, approximately $1,864 per square foot. 2210 73rd St is a home located in Queens County with nearby schools including P.S. 2 Alfred Zimberg, Is 141 The Steinway, and William Cullen Bryant High School.
Ownership History
Date
Name
Owned For
Owner Type
Purchase Details
Closed on
Mar 10, 2021
Sold by
Dipietro Deceased John
Bought by
22-10 73Rd Street Llc
Current Estimated Value
Purchase Details
Closed on
Feb 26, 1998
Sold by
Petras Nicholas G
Bought by
Dipietro John and Dipietro Rosalie Sciortino
Home Financials for this Owner
Home Financials are based on the most recent Mortgage that was taken out on this home.
Original Mortgage
$270,000
Interest Rate
6.96%
Create a Home Valuation Report for This Property
The Home Valuation Report is an in-depth analysis detailing your home's value as well as a comparison with similar homes in the area
Home Values in the Area
Average Home Value in this Area
Purchase History
| Date | Buyer | Sale Price | Title Company |
|---|---|---|---|
| 22-10 73Rd Street Llc | -- | -- | |
| Dipietro John | $300,000 | -- |
Source: Public Records
Mortgage History
| Date | Status | Borrower | Loan Amount |
|---|---|---|---|
| Previous Owner | Dipietro John | $270,000 |
Source: Public Records
Tax History Compared to Growth
Tax History
| Year | Tax Paid | Tax Assessment Tax Assessment Total Assessment is a certain percentage of the fair market value that is determined by local assessors to be the total taxable value of land and additions on the property. | Land | Improvement |
|---|---|---|---|---|
| 2025 | $13,612 | $71,837 | $7,636 | $64,201 |
| 2024 | $13,612 | $67,771 | $6,766 | $61,005 |
| 2023 | $12,985 | $63,936 | $6,924 | $57,012 |
| 2022 | $12,764 | $84,900 | $11,040 | $73,860 |
| 2021 | $13,354 | $90,780 | $11,040 | $79,740 |
| 2020 | $12,671 | $81,660 | $11,040 | $70,620 |
| 2019 | $11,814 | $89,460 | $11,040 | $78,420 |
| 2018 | $10,861 | $53,280 | $8,115 | $45,165 |
| 2017 | $10,861 | $53,280 | $8,653 | $44,627 |
| 2016 | $10,571 | $53,280 | $8,653 | $44,627 |
| 2015 | $5,900 | $49,887 | $11,525 | $38,362 |
| 2014 | $5,900 | $47,064 | $12,016 | $35,048 |
Source: Public Records
Map
Nearby Homes
- 22-26 74th St
- 70-07 Ditmars Blvd
- 22-39 74th St
- 2230 75th St
- 2144 73rd St
- 21-38 73rd St
- 2134 74th St
- 2208 76th St Unit A3
- 22-27 76 St Unit B2
- 2209 76th St Unit C2
- 70-11 Ditmars Blvd
- 76-12 Ditmars Blvd Unit B3
- 22-28 77th St Unit C1
- 22-31 77th St Unit C2
- 2220 78th St Unit A3
- 21-16 77 Street 2nd Floor
- 21-40 78th St Unit 2
- 20-50 Hazen St
- 22-39 78 St
- 2255 78th St Unit 2E
- 22-10 73rd St
- 2206 73rd St
- 2214 73rd St
- 7212 Ditmars Blvd
- 2202 73rd St
- 72-10 Ditmars Blvd
- 7210 Ditmars Blvd
- 2211 72nd St
- 7206 Ditmars Blvd
- 2220 73rd St
- 2217 72nd St
- 73-02 Ditmars Blvd Unit 2
- 73-02 Ditmars Blvd Unit 3
- 73-02 Ditmars Blvd Unit 1
- 73-02 Ditmars Blvd Unit PH
- 7302 Ditmars Blvd
- 7204 Ditmars Blvd
- 7304 Ditmars Blvd
- 2215 73rd St
- 2221 72nd St