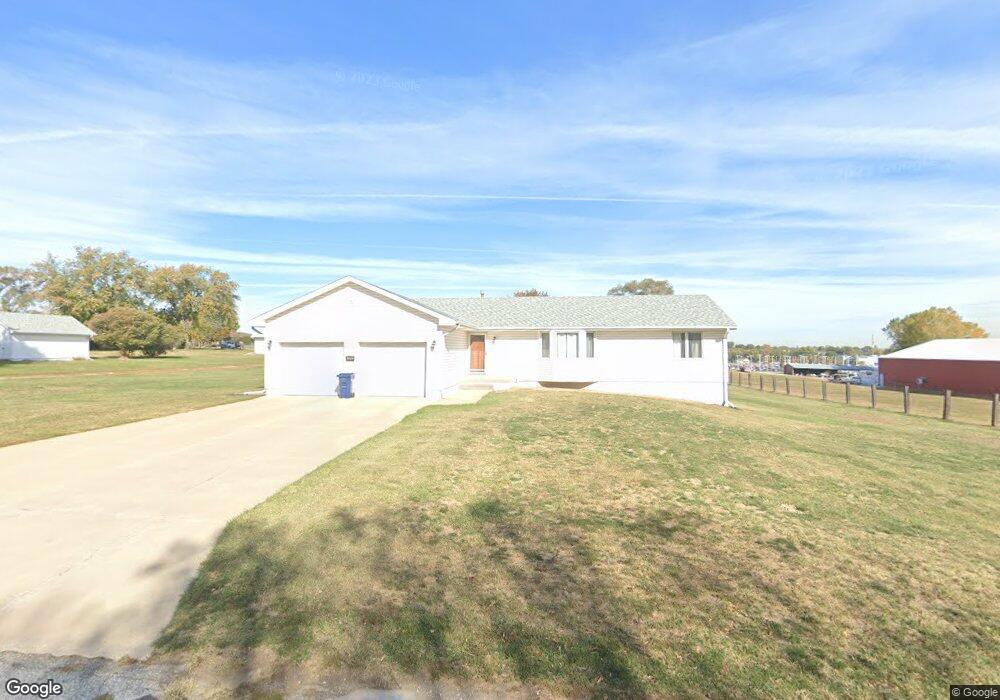
2210 Cornelia St Bellevue, NE 68147
Estimated Value: $345,694 - $368,000
2
Beds
2
Baths
1,623
Sq Ft
$220/Sq Ft
Est. Value
About This Home
This home is located at 2210 Cornelia St, Bellevue, NE 68147 and is currently estimated at $356,898, approximately $219 per square foot. 2210 Cornelia St is a home located in Sarpy County with nearby schools including Chandler View Elementary School, Bryan Middle School, and Bryan High School.
Ownership History
Date
Name
Owned For
Owner Type
Purchase Details
Closed on
Apr 15, 2020
Sold by
Timmerman Kathryn A
Bought by
Timmerman Richard G
Current Estimated Value
Purchase Details
Closed on
Sep 16, 2005
Sold by
Timmerman Richard Gene and Timmerman Jean M
Bought by
Timmerman Kathryn A
Home Financials for this Owner
Home Financials are based on the most recent Mortgage that was taken out on this home.
Original Mortgage
$140,000
Outstanding Balance
$75,042
Interest Rate
5.88%
Mortgage Type
Fannie Mae Freddie Mac
Estimated Equity
$281,856
Purchase Details
Closed on
Jul 9, 2004
Sold by
Timmerman Richard Gene and Timmerman Jean M
Bought by
Timmerman Richard Gene and Timmerman Spjean M
Home Financials for this Owner
Home Financials are based on the most recent Mortgage that was taken out on this home.
Original Mortgage
$186,000
Interest Rate
9.47%
Mortgage Type
Stand Alone Refi Refinance Of Original Loan
Create a Home Valuation Report for This Property
The Home Valuation Report is an in-depth analysis detailing your home's value as well as a comparison with similar homes in the area
Home Values in the Area
Average Home Value in this Area
Purchase History
| Date | Buyer | Sale Price | Title Company |
|---|---|---|---|
| Timmerman Richard G | -- | Trustworthy Title & Escrow | |
| Timmerman Kathryn A | $190,000 | Liberty Title | |
| Timmerman Richard Gene | -- | Nations Title Agency Inc |
Source: Public Records
Mortgage History
| Date | Status | Borrower | Loan Amount |
|---|---|---|---|
| Open | Timmerman Kathryn A | $140,000 | |
| Previous Owner | Timmerman Richard Gene | $186,000 |
Source: Public Records
Tax History
| Year | Tax Paid | Tax Assessment Tax Assessment Total Assessment is a certain percentage of the fair market value that is determined by local assessors to be the total taxable value of land and additions on the property. | Land | Improvement |
|---|---|---|---|---|
| 2025 | $140 | $318,931 | $54,000 | $264,931 |
| 2024 | $5,868 | $293,504 | $54,000 | $239,504 |
| 2023 | $5,868 | $271,846 | $54,000 | $217,846 |
| 2022 | $308 | $251,675 | $54,000 | $197,675 |
| 2021 | $5,264 | $239,586 | $54,000 | $185,586 |
| 2020 | $4,887 | $220,949 | $49,500 | $171,449 |
| 2019 | $4,576 | $206,551 | $49,500 | $157,051 |
| 2018 | $3,506 | $193,918 | $47,600 | $146,318 |
| 2017 | $3,452 | $189,392 | $47,600 | $141,792 |
| 2016 | $3,335 | $184,439 | $47,600 | $136,839 |
| 2015 | $3,247 | $184,745 | $58,900 | $125,845 |
| 2014 | $3,092 | $177,707 | $48,000 | $129,707 |
| 2012 | -- | $178,530 | $48,000 | $130,530 |
Source: Public Records
Map
Nearby Homes
- 2206 Citta Cir
- 8688 S 23rd St
- 2201 Citta Cir
- 2205 Citta Cir
- 8706 S 23rd St
- 8711 S 23rd St
- 8710 S 23rd St
- 2529 Mose Ave Unit 9A
- 8715 S 23rd St
- 8714 S 23rd St
- 2034 Concord Cir
- 2605 Virginia St
- 2030 Concord Cir
- 2026 Concord Cir
- 2022 Concord Cir
- 2018 Concord Cir
- 2014 Concord Cir
- 2616 Rose Lane Rd
- 2455 Rose Lane Rd
- 7515 S 18th St
- 2216 Cornelia St
- 2215 Cornelia St
- 2113 Cornelia St
- 2211 Cornelia St
- 8200 S 23rd St
- 2302 Cornelia St
- 8214 S 23rd St
- 8251 S 23rd St
- 2009 Cornelia St
- 2306 Robin Dr
- 2305 Cornelia St
- 8255 S 23rd St
- 8005 S 25th St
- 2310 Robin Dr
- 8260 S 21st St
- 2210 Childs Rd W
- 7907 S 22nd Ave
- 2305 Robin Dr
- 7908 S 22nd Ave
- 2218 Childs Rd W
Your Personal Tour Guide
Ask me questions while you tour the home.