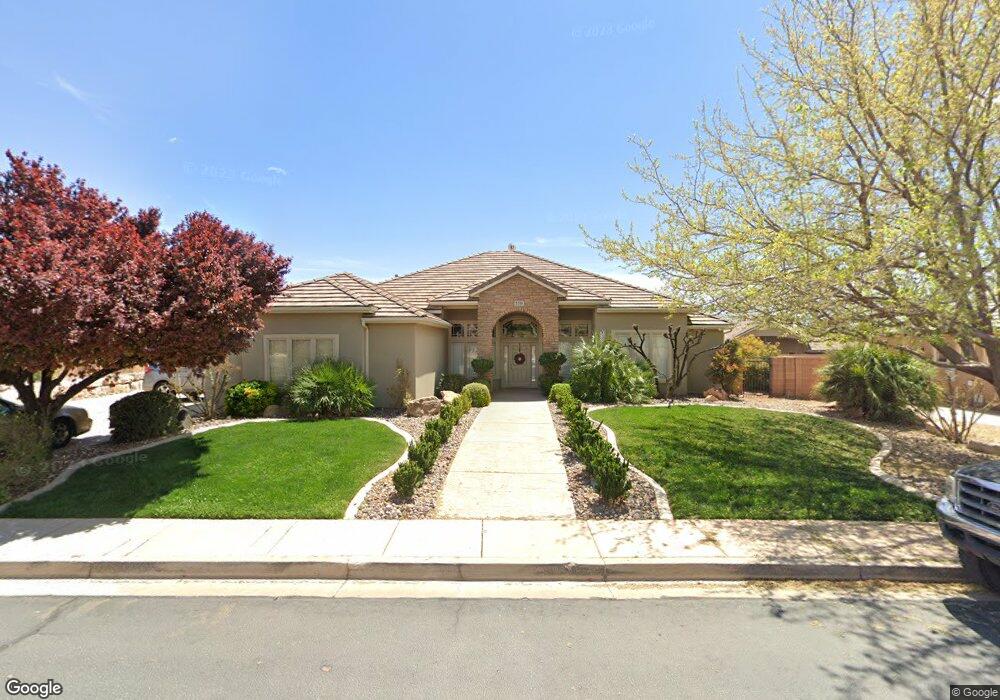
2210 E 2610 S Saint George, UT 84790
Estimated Value: $591,636 - $650,000
3
Beds
3
Baths
2,233
Sq Ft
$279/Sq Ft
Est. Value
About This Home
This home is located at 2210 E 2610 S, Saint George, UT 84790 and is currently estimated at $623,159, approximately $279 per square foot. 2210 E 2610 S is a home located in Washington County with nearby schools including Crimson View Elementary School, Sunrise Ridge Intermediate School, and Desert Hills Middle School.
Ownership History
Date
Name
Owned For
Owner Type
Purchase Details
Closed on
Aug 8, 2024
Sold by
Jensen Craig R and Jensen Penny S
Bought by
Craig Robert Jensen And Penny Sue Jensen Livi and Jensen
Current Estimated Value
Purchase Details
Closed on
Jun 29, 2007
Sold by
Jensen Craig R and Jensen Penny F
Bought by
Jensen Craig R and Jensen Penny S
Home Financials for this Owner
Home Financials are based on the most recent Mortgage that was taken out on this home.
Original Mortgage
$30,000
Interest Rate
6.21%
Mortgage Type
New Conventional
Purchase Details
Closed on
Oct 13, 2006
Sold by
Jenscn Craig R
Bought by
Jensen Craig R and Jensen Penny F
Purchase Details
Closed on
Jan 26, 2005
Sold by
Salisbury Development Lc
Bought by
Jensen Craig R
Home Financials for this Owner
Home Financials are based on the most recent Mortgage that was taken out on this home.
Original Mortgage
$25,500
Interest Rate
5.81%
Mortgage Type
Credit Line Revolving
Create a Home Valuation Report for This Property
The Home Valuation Report is an in-depth analysis detailing your home's value as well as a comparison with similar homes in the area
Purchase History
| Date | Buyer | Sale Price | Title Company |
|---|---|---|---|
| Craig Robert Jensen And Penny Sue Jensen Livi | -- | None Listed On Document | |
| Jensen Craig R | -- | First American | |
| Jensen Craig R | -- | Atlas Title Co | |
| Jensen Craig R | -- | Southern Utah Title Co |
Source: Public Records
Mortgage History
| Date | Status | Borrower | Loan Amount |
|---|---|---|---|
| Previous Owner | Jensen Craig R | $30,000 | |
| Previous Owner | Jensen Craig R | $25,500 | |
| Previous Owner | Jensen Craig R | $204,150 |
Source: Public Records
Tax History
| Year | Tax Paid | Tax Assessment Tax Assessment Total Assessment is a certain percentage of the fair market value that is determined by local assessors to be the total taxable value of land and additions on the property. | Land | Improvement |
|---|---|---|---|---|
| 2025 | $2,135 | $318,120 | $110,000 | $208,120 |
| 2023 | $2,178 | $325,380 | $93,500 | $231,880 |
| 2022 | $2,213 | $310,970 | $79,750 | $231,220 |
| 2021 | $1,944 | $407,300 | $125,000 | $282,300 |
| 2020 | $1,779 | $351,100 | $105,000 | $246,100 |
| 2019 | $1,753 | $338,000 | $105,000 | $233,000 |
| 2018 | $1,701 | $169,345 | $0 | $0 |
| 2017 | $1,621 | $156,695 | $0 | $0 |
| 2016 | $1,627 | $145,420 | $0 | $0 |
| 2015 | $1,664 | $142,725 | $0 | $0 |
| 2014 | $1,604 | $138,435 | $0 | $0 |
Source: Public Records
Map
Nearby Homes
- 2553 S 2070 E
- 2553 S 2070 E
- 2247 E Coyote Springs Dr
- 2208 E 2480 S
- 2703 S 2070 E
- 2434 S 2160 E
- 2516 S 2350 E
- 2291 E 2800 S
- 2206 E 2800 S
- 1907 Brisa Ct
- 2345 S 1950 E
- 2503 E Suniva Way
- 245 Red Dr Unit 209
- 1373 E White Ln
- 3021 E Banded Dr
- 2632 E Wake Ln
- 959 W Velvet Ridge Cove
- 3141 E 2220 St S Unit 303
- 14 Knettas Knoll Subdivision Unit 14
- 3125 E 2220 S
- 2192 E 2610 S
- 2192 E 2610 S Unit 72
- 2224 E 2610 S
- 2224 E 2610 S Unit 70
- 2594 2220 St E
- 2213 Rustic Dr
- 2229 Rustic Dr
- 2229 E Rustic Dr
- 2195 E Rustic Dr Unit Private pool
- 2195 E Rustic Dr
- 2195 Rustic Dr
- 2594 S 2220 East Cir
- 2629 S 2160 E
- 2238 E 2610 S
- 2594 S 2220 E
- 2241 Rustic Dr
- 2241 E Rustic Dr
- 2177 Rustic Dr
- 2597 S 2160 E
- 2252 E 2610 S
Your Personal Tour Guide
Ask me questions while you tour the home.