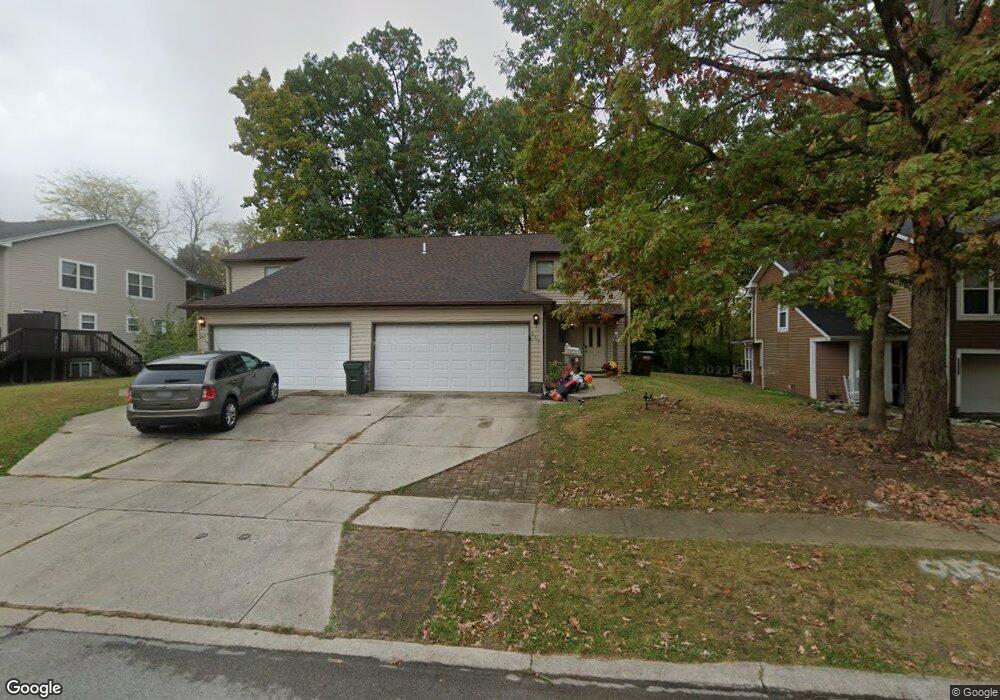
2210 Grierson Place Fairborn, OH 45324
Estimated Value: $325,000 - $340,000
6
Beds
6
Baths
1,440
Sq Ft
$228/Sq Ft
Est. Value
About This Home
This home is located at 2210 Grierson Place, Fairborn, OH 45324 and is currently estimated at $329,030, approximately $228 per square foot. 2210 Grierson Place is a home located in Greene County with nearby schools including Fairborn Primary School, Fairborn Intermediate School, and Fairborn Middle School.
Ownership History
Date
Name
Owned For
Owner Type
Purchase Details
Closed on
May 22, 2015
Sold by
Lawrence Michael P
Bought by
Riley Brent W
Current Estimated Value
Home Financials for this Owner
Home Financials are based on the most recent Mortgage that was taken out on this home.
Original Mortgage
$141,311
Outstanding Balance
$108,105
Interest Rate
3.49%
Mortgage Type
Commercial
Estimated Equity
$220,925
Purchase Details
Closed on
Feb 10, 2015
Sold by
Warner Joseph C and Warner Kimberly E
Bought by
Lawrence Michael P and The Estate Of Lois Jane Lawrence
Purchase Details
Closed on
Dec 15, 2010
Sold by
Elliott Frederick B and Elliott Roberta S
Bought by
Warner Joseph C
Purchase Details
Closed on
Mar 30, 2001
Sold by
Aukerman Jeanene K and Elliott Frederick B
Bought by
Elliott Frederick B
Home Financials for this Owner
Home Financials are based on the most recent Mortgage that was taken out on this home.
Original Mortgage
$68,500
Interest Rate
7.05%
Mortgage Type
Commercial
Create a Home Valuation Report for This Property
The Home Valuation Report is an in-depth analysis detailing your home's value as well as a comparison with similar homes in the area
Home Values in the Area
Average Home Value in this Area
Purchase History
| Date | Buyer | Sale Price | Title Company |
|---|---|---|---|
| Riley Brent W | $166,250 | Hallmark Title | |
| Lawrence Michael P | $165,000 | None Available | |
| Warner Joseph C | $152,900 | Attorney | |
| Elliott Frederick B | -- | -- |
Source: Public Records
Mortgage History
| Date | Status | Borrower | Loan Amount |
|---|---|---|---|
| Open | Riley Brent W | $141,311 | |
| Previous Owner | Elliott Frederick B | $68,500 |
Source: Public Records
Tax History Compared to Growth
Tax History
| Year | Tax Paid | Tax Assessment Tax Assessment Total Assessment is a certain percentage of the fair market value that is determined by local assessors to be the total taxable value of land and additions on the property. | Land | Improvement |
|---|---|---|---|---|
| 2024 | $4,030 | $85,300 | $11,420 | $73,880 |
| 2023 | $4,030 | $85,300 | $11,420 | $73,880 |
| 2022 | $3,512 | $62,540 | $7,610 | $54,930 |
| 2021 | $3,564 | $62,540 | $7,610 | $54,930 |
| 2020 | $3,583 | $62,540 | $7,610 | $54,930 |
| 2019 | $3,276 | $57,310 | $5,990 | $51,320 |
| 2018 | $3,311 | $57,310 | $5,990 | $51,320 |
| 2017 | $3,143 | $57,310 | $5,990 | $51,320 |
| 2016 | $3,144 | $55,040 | $5,990 | $49,050 |
| 2015 | $3,076 | $55,040 | $5,990 | $49,050 |
| 2014 | $1,576 | $55,040 | $5,990 | $49,050 |
Source: Public Records
Map
Nearby Homes
- 2133 Chapel Dr
- 523 Greene Tree Place
- 474 Kalynn Cir
- 474 Kalynn Cir Unit 19
- 441 Kalynn Cir Unit 25
- 479 Park Hills Crossing Unit 17
- 479 Park Hills Crossing
- 2148 Beaver Valley Rd
- 1943 Fraternity Ct
- 2348 Patrick Blvd
- 1606 Hillrose Place
- 2833 Hackberry Ln
- 474 Glenhaven Way Unit 755-303
- 518 Glenhaven Way Unit 756-305
- 470 Glenhaven Way Unit 755-301
- 456 Glenhaven Way Unit 754-304
- 1558 Glendale Dr
- 462 Glenhaven Way Unit 755-202
- 464 Glenhaven Way Unit 755-203
- 502 Glenhaven Way
- 2210 Grierson Place Unit 2212
- 2214 Grierson Place
- 2216 Grierson Place
- 2214 Grierson Place
- 442 Sycamore Dr
- 442 Sycamore Dr Unit 448
- 446 Sycamore Dr
- 2218 Grierson Place
- 2218 Grierson Place Unit 2220
- 2220 Grierson Place
- 2211 Grierson Place
- 2215 Grierson Place
- 430 Sycamore Dr Unit 430
- 430 Sycamore Dr Unit 436
- 430 Sycamore Dr
- 436 Sycamore Dr
- 434 Sycamore Dr
- 2224 Grierson Place
- 2222 Grierson Place Unit 2222
- 2219 Grierson Place