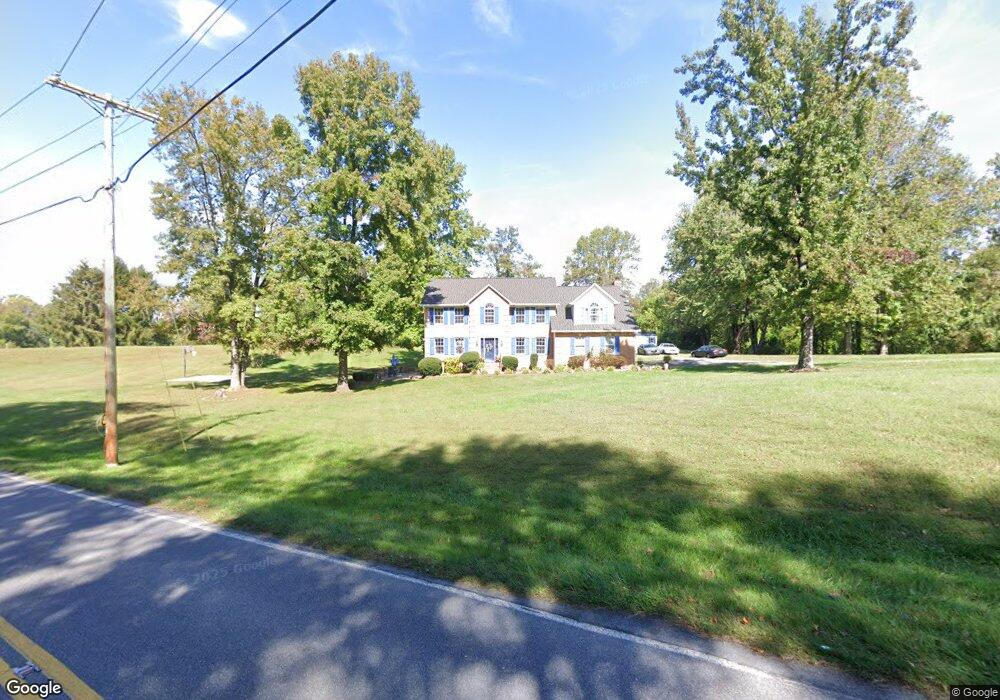
2210 Line Ridge Dr Huntingtown, MD 20639
Estimated Value: $700,000 - $799,000
5
Beds
4
Baths
5,500
Sq Ft
$136/Sq Ft
Est. Value
About This Home
This home is located at 2210 Line Ridge Dr, Huntingtown, MD 20639 and is currently estimated at $746,340, approximately $135 per square foot. 2210 Line Ridge Dr is a home located in Calvert County with nearby schools including Plum Point Elementary School, Plum Point Middle School, and Huntingtown High School.
Ownership History
Date
Name
Owned For
Owner Type
Purchase Details
Closed on
Jan 12, 2013
Sold by
Mackall Jones Lisa L and Jones Lavelle J
Bought by
Mackall Jones Lisa L
Current Estimated Value
Purchase Details
Closed on
Jan 15, 2004
Sold by
Bailey Steve A and Bailey Wanda A
Bought by
Jones Lisa L and Jones Laveille J
Purchase Details
Closed on
Mar 4, 1994
Sold by
Quality Built Homes
Bought by
Bailey Steve A
Home Financials for this Owner
Home Financials are based on the most recent Mortgage that was taken out on this home.
Original Mortgage
$227,050
Interest Rate
7.01%
Purchase Details
Closed on
Nov 9, 1993
Sold by
Chavis J A
Bought by
Quality Built Homes
Home Financials for this Owner
Home Financials are based on the most recent Mortgage that was taken out on this home.
Original Mortgage
$188,500
Interest Rate
6.83%
Create a Home Valuation Report for This Property
The Home Valuation Report is an in-depth analysis detailing your home's value as well as a comparison with similar homes in the area
Home Values in the Area
Average Home Value in this Area
Purchase History
| Date | Buyer | Sale Price | Title Company |
|---|---|---|---|
| Mackall Jones Lisa L | -- | None Available | |
| Jones Lisa L | $415,000 | -- | |
| Bailey Steve A | $252,292 | -- | |
| Quality Built Homes | $55,000 | -- |
Source: Public Records
Mortgage History
| Date | Status | Borrower | Loan Amount |
|---|---|---|---|
| Previous Owner | Quality Built Homes | $227,050 | |
| Previous Owner | Quality Built Homes | $188,500 | |
| Closed | Jones Lisa L | -- |
Source: Public Records
Tax History Compared to Growth
Tax History
| Year | Tax Paid | Tax Assessment Tax Assessment Total Assessment is a certain percentage of the fair market value that is determined by local assessors to be the total taxable value of land and additions on the property. | Land | Improvement |
|---|---|---|---|---|
| 2025 | $6,679 | $598,400 | $150,700 | $447,700 |
| 2024 | $6,287 | $562,600 | $0 | $0 |
| 2023 | $5,687 | $526,800 | $0 | $0 |
| 2022 | $5,312 | $491,000 | $150,700 | $340,300 |
| 2021 | $4,854 | $468,167 | $0 | $0 |
| 2020 | $4,854 | $445,333 | $0 | $0 |
| 2019 | $4,634 | $422,500 | $150,700 | $271,800 |
| 2018 | $4,530 | $413,867 | $0 | $0 |
| 2017 | $4,498 | $405,233 | $0 | $0 |
| 2016 | -- | $396,600 | $0 | $0 |
| 2015 | $4,384 | $396,600 | $0 | $0 |
| 2014 | $4,384 | $396,600 | $0 | $0 |
Source: Public Records
Map
Nearby Homes
- 4950 Hardesty Rd
- 2785 Ponds Wood Rd
- 694 Ponds Wood Rd
- 3100 Drawfield Ln
- 2970 Stinnett Rd
- 2825 Karen Dr
- 3164 Dalrymple Rd
- 124 Turnabout Ln
- 3750 Elberta Ln
- 335 Summitwood Dr
- 111 Autumn Ct
- 4115 Calvert Dr
- 570 Marley Run
- 465 Sablewood Dr
- 4685 Camp Roosevelt Dr
- 5460 Solomons Island Rd
- 5150 Lenoir Dr
- 2950 Tobacco Rd
- 525 Small Reward Rd
- 5209 Larchmont Dr
- 2220 Line Ridge Dr
- 4301 Hardesty Ct
- 4260 Hardesty Rd Unit GUY
- 4270 Hardesty Rd
- 4270 Hardesty Rd Unit GUY
- 4255 Hardesty Rd
- 2215 Line Ridge Dr
- 4311 Hardesty Ct
- 2230 Line Ridge Dr
- 4250 Hardesty Rd Unit GUY
- 4250 Hardesty Rd Unit GUY
- 4250 Hardesty Rd
- 4300 Hardesty Ct
- 2225 Line Ridge Dr
- 4412 Hardesty Rd
- 4420 Foxfire Ln
- 4230 Hardesty Rd Unit GUY
- 4321 Hardesty Ct
- 4240 Hardesty Rd Unit GUY
- 4320 Hardesty Ct