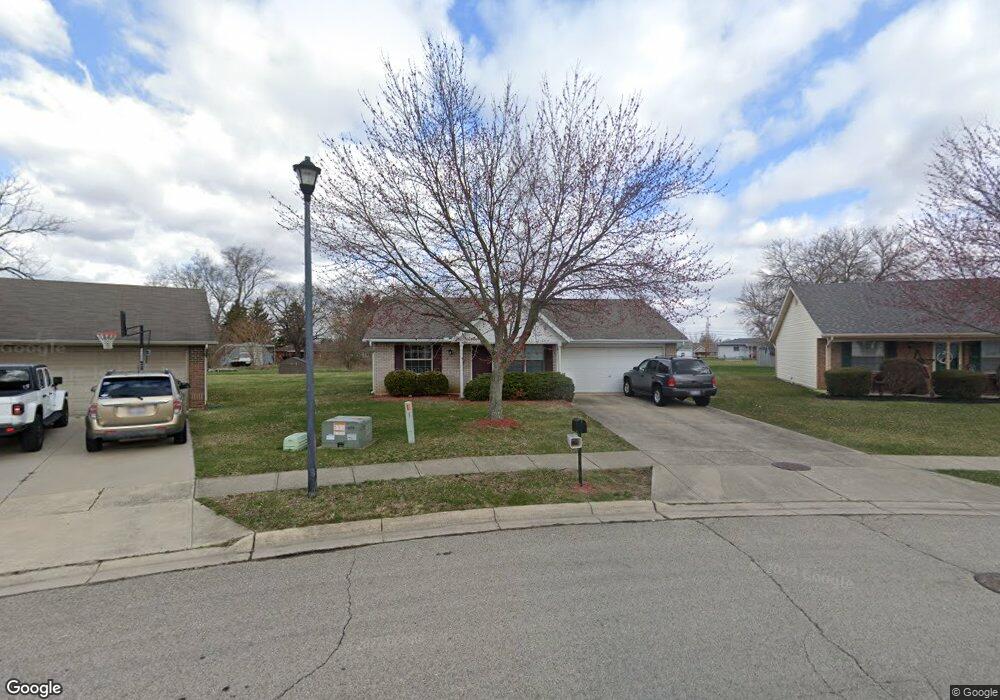
2210 Neon St Springfield, OH 45503
Estimated Value: $158,000 - $208,000
3
Beds
2
Baths
1,048
Sq Ft
$181/Sq Ft
Est. Value
About This Home
This home is located at 2210 Neon St, Springfield, OH 45503 and is currently estimated at $189,559, approximately $180 per square foot. 2210 Neon St is a home located in Clark County with nearby schools including Rolling Hills Elementary School, Northridge Middle School, and Kenton Ridge Middle & High School.
Ownership History
Date
Name
Owned For
Owner Type
Purchase Details
Closed on
Feb 22, 2022
Sold by
Neeld Jonathan P and Neeld Darcy N
Bought by
Mcgath Daniel
Current Estimated Value
Purchase Details
Closed on
Feb 3, 2021
Sold by
Janco Llc
Bought by
Neeld Jonathan P and Neeld Darcy N
Home Financials for this Owner
Home Financials are based on the most recent Mortgage that was taken out on this home.
Original Mortgage
$114,300
Interest Rate
2.6%
Mortgage Type
Purchase Money Mortgage
Purchase Details
Closed on
Dec 5, 2003
Sold by
Janco Partners
Bought by
Janco Llc
Create a Home Valuation Report for This Property
The Home Valuation Report is an in-depth analysis detailing your home's value as well as a comparison with similar homes in the area
Home Values in the Area
Average Home Value in this Area
Purchase History
| Date | Buyer | Sale Price | Title Company |
|---|---|---|---|
| Mcgath Daniel | $140,000 | Team Title & Closing Services | |
| Neeld Jonathan P | $127,000 | None Available | |
| Neeld Jonathan P | $127,000 | None Listed On Document | |
| Janco Llc | -- | -- |
Source: Public Records
Mortgage History
| Date | Status | Borrower | Loan Amount |
|---|---|---|---|
| Previous Owner | Neeld Jonathan P | $114,300 |
Source: Public Records
Tax History Compared to Growth
Tax History
| Year | Tax Paid | Tax Assessment Tax Assessment Total Assessment is a certain percentage of the fair market value that is determined by local assessors to be the total taxable value of land and additions on the property. | Land | Improvement |
|---|---|---|---|---|
| 2024 | $343 | $45,530 | $11,590 | $33,940 |
| 2023 | $2,764 | $45,530 | $11,590 | $33,940 |
| 2022 | $1,916 | $45,530 | $11,590 | $33,940 |
| 2021 | $1,886 | $38,450 | $9,660 | $28,790 |
| 2020 | $1,888 | $38,450 | $9,660 | $28,790 |
| 2019 | $1,926 | $38,450 | $9,660 | $28,790 |
| 2018 | $1,616 | $31,170 | $9,660 | $21,510 |
| 2017 | $1,379 | $35,231 | $9,660 | $25,571 |
| 2016 | $1,369 | $35,231 | $9,660 | $25,571 |
| 2015 | $825 | $35,231 | $9,660 | $25,571 |
| 2014 | $1,649 | $35,231 | $9,660 | $25,571 |
| 2013 | $1,646 | $35,231 | $9,660 | $25,571 |
Source: Public Records
Map
Nearby Homes
- 3112 Country Side Ct Unit 3112
- 3316 Sudbury St
- 2939 Mechanicsburg Rd
- 1920 Wedgewood Cir
- 2805 Old Oak Ln
- 1922 Wedgewood Cir
- 2022 Westboro Ave
- 3231 Vineyard St
- 3214 Revels St
- 3231 Revels St
- 3264 Tackett St
- 3131 Revels St
- 3500 Oakmont Ct
- 1939 Providence Ave
- 3452 Bosart Rd
- 3129 Haverhill St
- 1732 Falmouth Ave
- 1781 Pinehurst Dr
- 1507 Kingsgate Rd