2210 S Belmont Dr Richmond, TX 77469
Estimated Value: $307,000 - $367,000
3
Beds
2
Baths
2,642
Sq Ft
$125/Sq Ft
Est. Value
About This Home
This home is located at 2210 S Belmont Dr, Richmond, TX 77469 and is currently estimated at $329,476, approximately $124 per square foot. 2210 S Belmont Dr is a home located in Fort Bend County with nearby schools including Jane Long Elementary School, J J Wessendorff Middle School, and Lamar Junior High School.
Ownership History
Date
Name
Owned For
Owner Type
Purchase Details
Closed on
Jun 17, 2004
Sold by
Hollan Albert E and Hart Peggy J
Bought by
Hitt Michael G
Current Estimated Value
Home Financials for this Owner
Home Financials are based on the most recent Mortgage that was taken out on this home.
Original Mortgage
$115,200
Outstanding Balance
$57,519
Interest Rate
6.32%
Mortgage Type
Purchase Money Mortgage
Estimated Equity
$271,957
Purchase Details
Closed on
Feb 25, 2003
Sold by
Harwell Judith L and Trojok Judith
Bought by
Hollan Albert E and Hart Peggy J
Home Financials for this Owner
Home Financials are based on the most recent Mortgage that was taken out on this home.
Original Mortgage
$60,000
Interest Rate
5.83%
Mortgage Type
Seller Take Back
Purchase Details
Closed on
Dec 18, 2002
Sold by
Nunez Gabrielle A and Trojok Gabrielle A
Bought by
Harwell Judith L and Trojok Judith
Create a Home Valuation Report for This Property
The Home Valuation Report is an in-depth analysis detailing your home's value as well as a comparison with similar homes in the area
Home Values in the Area
Average Home Value in this Area
Purchase History
| Date | Buyer | Sale Price | Title Company |
|---|---|---|---|
| Hitt Michael G | -- | American Title Co | |
| Hollan Albert E | -- | American Title Co | |
| Hitt Michael G | -- | -- | |
| Harwell Judith L | -- | -- | |
| Hitt Michael G | -- | -- |
Source: Public Records
Mortgage History
| Date | Status | Borrower | Loan Amount |
|---|---|---|---|
| Open | Hitt Michael G | $115,200 | |
| Previous Owner | Hitt Michael G | $60,000 | |
| Closed | Hitt Michael G | $28,800 |
Source: Public Records
Tax History Compared to Growth
Tax History
| Year | Tax Paid | Tax Assessment Tax Assessment Total Assessment is a certain percentage of the fair market value that is determined by local assessors to be the total taxable value of land and additions on the property. | Land | Improvement |
|---|---|---|---|---|
| 2025 | $1,794 | $246,022 | $23,400 | $253,278 |
| 2024 | $1,794 | $223,656 | -- | $277,687 |
| 2023 | $1,645 | $203,324 | $0 | $301,141 |
| 2022 | $2,861 | $184,840 | $0 | $244,430 |
| 2021 | $3,991 | $168,040 | $18,000 | $150,040 |
| 2020 | $4,031 | $167,270 | $16,500 | $150,770 |
| 2019 | $4,191 | $164,110 | $16,500 | $147,610 |
| 2018 | $4,119 | $160,340 | $16,500 | $143,840 |
| 2017 | $4,037 | $155,310 | $16,500 | $138,810 |
| 2016 | $4,042 | $155,510 | $16,500 | $139,010 |
| 2015 | $2,756 | $156,430 | $16,500 | $139,930 |
| 2014 | $2,875 | $152,650 | $16,500 | $136,150 |
Source: Public Records
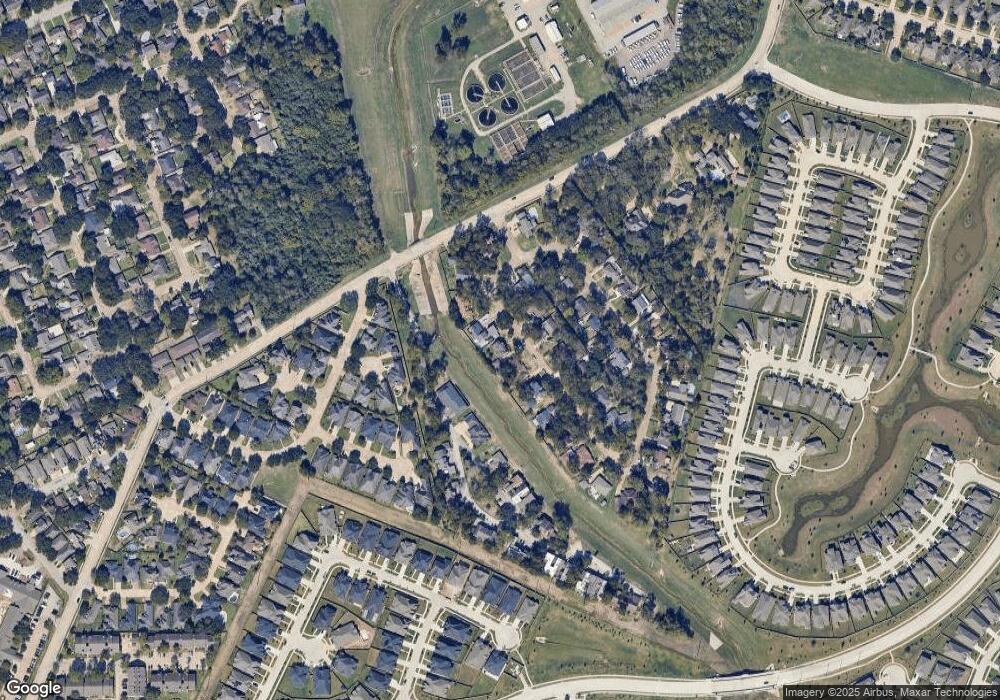
Map
Nearby Homes
- 2236 Par Ln
- 1810 Winston Store Loop
- 24007 Barnett Overlook
- 1911 Winston Store Loop
- 805 Chateau Place
- 2001 Briar Ln
- 406 Fairway Dr
- 2015 Tanglelane St
- 0 Meadow Ln
- 2811 Cone Flower Dr
- 23743 Travers Hill Rd
- 23719 Sweeny Valley Dr
- 23714 Sweeny Valley Dr
- 23814 Pullin Market Dr
- 2008 Golden Creek Ln
- 24323 Rose Cobbler Dr
- 1004 Country Club Dr
- 0 Fm 2218 Unit 25550047
- 400 Hillcrest Dr
- 24351 Dyer Hill Way
- 2210 N Belmont Dr
- 2208 N Belmont Dr
- 2212 S Belmont Dr
- 2208 S Belmont Dr
- 2214 N Belmont Dr
- 2206 N Belmont Dr
- 2206 S Belmont Dr
- 2203 Par Ln
- 2211 Par Ln
- 2216 S Belmont Dr
- 2216 N Belmont Dr
- 2204 S Belmont Dr
- 808 Mulligan Ct
- 2212 N Belmont Dr
- 804 Mulligan Ct
- 2213 Par Ln
- 2218 S Belmont Dr
- 2214 Par Ln
- 2217 S Belmont Dr
- 616 Ironwood Ct