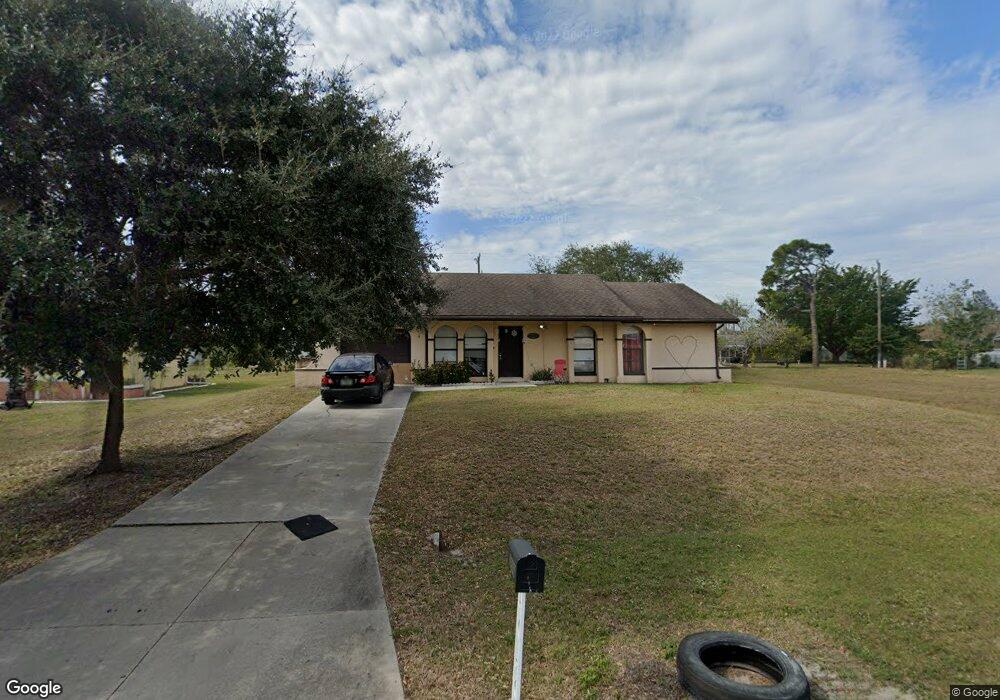
2210 SW 2nd Ct Cape Coral, FL 33991
Hancock NeighborhoodEstimated Value: $247,000 - $271,000
3
Beds
2
Baths
1,203
Sq Ft
$216/Sq Ft
Est. Value
About This Home
This home is located at 2210 SW 2nd Ct, Cape Coral, FL 33991 and is currently estimated at $259,655, approximately $215 per square foot. 2210 SW 2nd Ct is a home located in Lee County with nearby schools including Cape Elementary School, Caloosa Elementary School, and Tropic Isles Elementary School.
Ownership History
Date
Name
Owned For
Owner Type
Purchase Details
Closed on
Apr 14, 2020
Sold by
Jamaice Trio Llc
Bought by
Jamaica Trio Investments Inc
Current Estimated Value
Purchase Details
Closed on
Apr 4, 2014
Sold by
Jamaica Libia
Bought by
Trio Jamaica
Purchase Details
Closed on
Apr 29, 2011
Sold by
The Bank Of New York Mellon Trust Compan
Bought by
Jamaica Libia
Purchase Details
Closed on
Feb 28, 2011
Sold by
Brazel David R
Bought by
The Bank Of New York Mellon Trust Co Na
Purchase Details
Closed on
Sep 5, 2003
Sold by
Hinks Donald E
Bought by
Brazel David R
Home Financials for this Owner
Home Financials are based on the most recent Mortgage that was taken out on this home.
Original Mortgage
$85,000
Interest Rate
6.33%
Purchase Details
Closed on
Jun 28, 2002
Sold by
Fendler Thomas P and Fendler Thomas J
Bought by
Hinks Donald E
Create a Home Valuation Report for This Property
The Home Valuation Report is an in-depth analysis detailing your home's value as well as a comparison with similar homes in the area
Home Values in the Area
Average Home Value in this Area
Purchase History
| Date | Buyer | Sale Price | Title Company |
|---|---|---|---|
| Jamaica Trio Investments Inc | -- | None Available | |
| Trio Jamaica | -- | None Available | |
| Jamaica Libia | $36,200 | Working Title Llc | |
| The Bank Of New York Mellon Trust Co Na | $45,800 | None Available | |
| Brazel David R | $110,000 | -- | |
| Hinks Donald E | $4,800 | -- |
Source: Public Records
Mortgage History
| Date | Status | Borrower | Loan Amount |
|---|---|---|---|
| Previous Owner | Brazel David R | $85,000 |
Source: Public Records
Tax History Compared to Growth
Tax History
| Year | Tax Paid | Tax Assessment Tax Assessment Total Assessment is a certain percentage of the fair market value that is determined by local assessors to be the total taxable value of land and additions on the property. | Land | Improvement |
|---|---|---|---|---|
| 2025 | $4,301 | $184,024 | $66,215 | $116,427 |
| 2024 | $4,123 | $180,884 | -- | -- |
| 2023 | $4,123 | $164,440 | $0 | $0 |
| 2022 | $3,700 | $149,491 | $0 | $0 |
| 2021 | $3,434 | $135,910 | $29,185 | $106,725 |
| 2020 | $3,237 | $123,546 | $28,000 | $95,546 |
| 2019 | $3,179 | $121,117 | $25,500 | $95,617 |
| 2018 | $3,088 | $114,666 | $22,000 | $92,666 |
| 2017 | $2,944 | $107,393 | $12,000 | $95,393 |
| 2016 | $2,770 | $94,562 | $12,846 | $81,716 |
| 2015 | $2,622 | $85,496 | $10,219 | $75,277 |
| 2014 | $2,355 | $78,906 | $7,284 | $71,622 |
| 2013 | -- | $67,593 | $5,421 | $62,172 |
Source: Public Records
Map
Nearby Homes
- 2134 SW 2nd Ct Unit 62
- 2138 SW 3rd Ave
- 2135 SW 3rd Place
- 211 SW 21st Ln
- 334 SW 21st Terrace
- 232 SW 21st St
- 321 SW 23rd Terrace
- 2212 SW 4th Ave
- 2216 SW 4th Ave
- 118 SW 21st Terrace
- 432 SW 22nd St
- 217 SW 21st St
- 2135 SW 4th Ct
- 2223 SW 4th Ct
- 122 SW 21st St
- 421 SW 21st Terrace
- 216 SW 20th St
- 427 SW 21st Terrace
- 2133 SW 5th Ave
- 21 SW 21st St
- 2150 SW 2nd Ct
- 2214 SW 2nd Ct
- 2209 SW 3rd Ave
- 2213 SW 3rd Ave Unit 62
- 2146 SW 2nd Ct
- 225 SW 22nd Terrace
- 2218 SW 2nd Ct
- 2149 SW 3rd Ave
- 2217 SW 3rd Ave
- 2142 SW 2nd Ct
- 2221 SW 3rd Ave
- 221 SW 22nd Terrace
- 2145 SW 3rd Ave Unit 13
- 2224 SW 2nd Ct
- 2210 SW 3rd Ave
- 225 SW 22nd St
- 2150 SW 3rd Ave
- 2150 SW 3rd Ave Unit 28
- 2214 SW 3rd Ave
- 2138 SW 2nd Ct