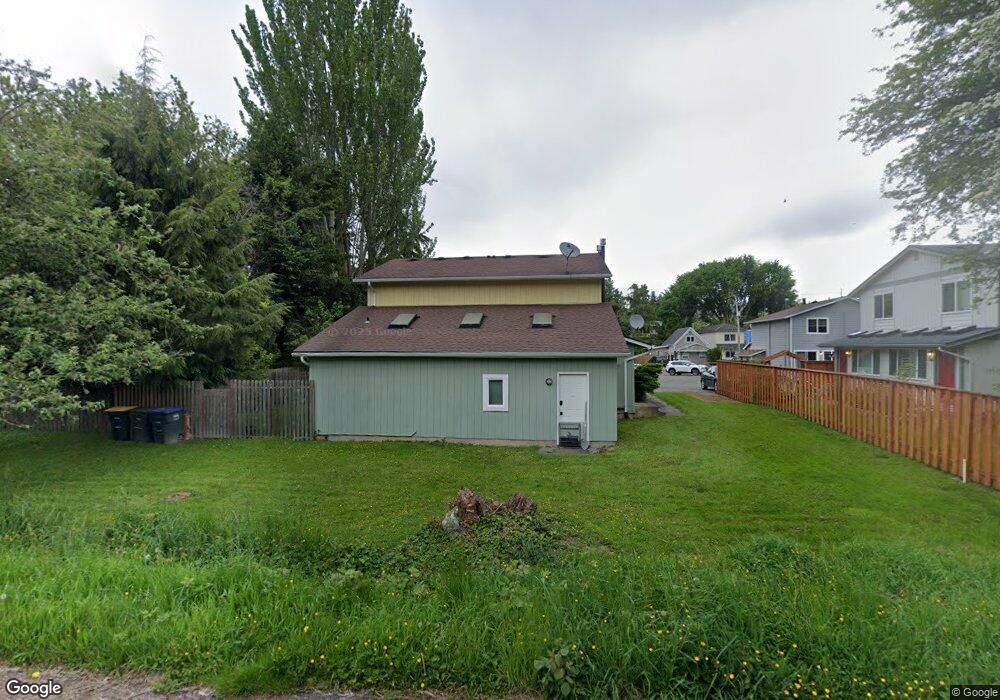
2210 Wilson Ave Bellingham, WA 98225
Happy Valley NeighborhoodEstimated Value: $709,000 - $831,000
--
Bed
1
Bath
700
Sq Ft
$1,078/Sq Ft
Est. Value
About This Home
This home is located at 2210 Wilson Ave, Bellingham, WA 98225 and is currently estimated at $754,502, approximately $1,077 per square foot. 2210 Wilson Ave is a home located in Whatcom County with nearby schools including Happy Valley Elementary School, Fairhaven Middle School, and Sehome High School.
Ownership History
Date
Name
Owned For
Owner Type
Purchase Details
Closed on
Apr 21, 2025
Sold by
Larson Eric J and Harrington Michelle
Bought by
Larson Tanner J and Larson Celia L
Current Estimated Value
Purchase Details
Closed on
Nov 7, 2003
Sold by
Gardner Steven M and Gardner Chantel L
Bought by
Larson Eric J and Larson Pamela R
Home Financials for this Owner
Home Financials are based on the most recent Mortgage that was taken out on this home.
Original Mortgage
$160,000
Interest Rate
6%
Mortgage Type
Unknown
Purchase Details
Closed on
Feb 21, 2003
Sold by
Gardner Steven M
Bought by
Gardner Steven M and Gardner Chantel L
Home Financials for this Owner
Home Financials are based on the most recent Mortgage that was taken out on this home.
Original Mortgage
$93,000
Interest Rate
5.93%
Create a Home Valuation Report for This Property
The Home Valuation Report is an in-depth analysis detailing your home's value as well as a comparison with similar homes in the area
Home Values in the Area
Average Home Value in this Area
Purchase History
| Date | Buyer | Sale Price | Title Company |
|---|---|---|---|
| Larson Tanner J | $313 | None Listed On Document | |
| Larson Eric J | $200,000 | Chicago Title Insurance | |
| Gardner Steven M | -- | Whatcom Land Title |
Source: Public Records
Mortgage History
| Date | Status | Borrower | Loan Amount |
|---|---|---|---|
| Previous Owner | Larson Eric J | $160,000 | |
| Previous Owner | Gardner Steven M | $93,000 |
Source: Public Records
Tax History Compared to Growth
Tax History
| Year | Tax Paid | Tax Assessment Tax Assessment Total Assessment is a certain percentage of the fair market value that is determined by local assessors to be the total taxable value of land and additions on the property. | Land | Improvement |
|---|---|---|---|---|
| 2024 | $5,775 | $716,566 | $371,668 | $344,898 |
| 2023 | $5,775 | $742,185 | $384,956 | $357,229 |
| 2022 | $4,755 | $631,650 | $327,624 | $304,026 |
| 2021 | $4,518 | $509,409 | $264,220 | $245,189 |
| 2020 | $4,439 | $446,846 | $231,770 | $215,076 |
| 2019 | $3,520 | $424,154 | $220,000 | $204,154 |
| 2018 | $3,639 | $337,242 | $148,103 | $189,139 |
| 2017 | $3,210 | $299,349 | $131,460 | $167,889 |
| 2016 | $2,923 | $275,650 | $120,960 | $154,690 |
| 2015 | $2,877 | $261,431 | $114,660 | $146,771 |
| 2014 | -- | $248,975 | $109,200 | $139,775 |
| 2013 | -- | $236,988 | $105,000 | $131,988 |
Source: Public Records
Map
Nearby Homes
- 2400 Donovan Ave Unit 13
- 2100 Lindsay Ave
- 1306 23rd St
- 1902 Wilson Ave
- 2694 Donovan Ave Unit 32
- 2015 24th St Unit 31
- 1121 22nd St
- 1605 Donovan Ave
- 3104 Wilson Ave
- 926 24th St
- 923 24th St
- 2815 Willis St
- 1302 Larrabee Ave
- 331 Chuckanut Dr N
- 425 Chuckanut Dr N Unit 5
- 1212 Old Fairhaven Pkwy Unit D202
- 1315 Mill Ave
- 1005 15th St
- 2600 16th St
- 1100 12th St
- 2212 Wilson Ave Unit A-B
- 2212 Wilson Ave
- 2208 Wilson Ave
- 2201 Happy Ct
- 1707 22nd St
- 2214 Wilson Ave
- 2201 2203 Happy Ct
- 2200 Wilson Ave
- 2300 Wilson Ave
- 2300 - 2302 Wilson Ave
- 2218 Happy Ct
- 1717 22nd St
- 2304 Wilson Ave
- 2302 2304 Happy Ct
- 2213 Wilson Ave
- 2302 Happy Ct
- 1727 22nd St
- 2219 Wilson Ave
- 2306 Wilson Ave Unit A & B
- 2306 Wilson Ave