22104 NE 269th St Battle Ground, WA 98604
Estimated Value: $606,401 - $714,000
3
Beds
2
Baths
1,704
Sq Ft
$388/Sq Ft
Est. Value
About This Home
This home is located at 22104 NE 269th St, Battle Ground, WA 98604 and is currently estimated at $661,100, approximately $387 per square foot. 22104 NE 269th St is a home located in Clark County with nearby schools including Tukes Valley Primary School, Tukes Valley Middle School, and Battle Ground High School.
Ownership History
Date
Name
Owned For
Owner Type
Purchase Details
Closed on
Jun 22, 2020
Sold by
Bardone Cheryl Lynn and Estate Of Gary Allen Bardone
Bought by
Bardone Cheryl Lynn
Current Estimated Value
Purchase Details
Closed on
Sep 6, 2002
Sold by
Ellingson Scott and Ellingson Cindy
Bought by
Tapani Tyler and Tapani Eva
Home Financials for this Owner
Home Financials are based on the most recent Mortgage that was taken out on this home.
Original Mortgage
$7,544
Outstanding Balance
$3,163
Interest Rate
6.29%
Estimated Equity
$657,937
Purchase Details
Closed on
May 10, 2001
Sold by
Levy Llc and Levanen Scott R
Bought by
Bardone Gary A and Bardone Cheryl Lynn
Home Financials for this Owner
Home Financials are based on the most recent Mortgage that was taken out on this home.
Original Mortgage
$165,080
Interest Rate
7.15%
Purchase Details
Closed on
Jul 8, 1998
Sold by
Cresap David M and Cresap Elaine
Bought by
Levy Llc
Create a Home Valuation Report for This Property
The Home Valuation Report is an in-depth analysis detailing your home's value as well as a comparison with similar homes in the area
Home Values in the Area
Average Home Value in this Area
Purchase History
| Date | Buyer | Sale Price | Title Company |
|---|---|---|---|
| Bardone Cheryl Lynn | -- | None Available | |
| Tapani Tyler | -- | Stewart Title | |
| Bardone Gary A | $72,400 | Charter Title Corporation | |
| Levy Llc | -- | Chicago Title Insurance Co |
Source: Public Records
Mortgage History
| Date | Status | Borrower | Loan Amount |
|---|---|---|---|
| Open | Tapani Tyler | $7,544 | |
| Previous Owner | Bardone Gary A | $165,080 |
Source: Public Records
Tax History Compared to Growth
Tax History
| Year | Tax Paid | Tax Assessment Tax Assessment Total Assessment is a certain percentage of the fair market value that is determined by local assessors to be the total taxable value of land and additions on the property. | Land | Improvement |
|---|---|---|---|---|
| 2025 | $4,402 | $540,979 | $254,459 | $286,520 |
| 2024 | $3,942 | $526,644 | $254,459 | $272,185 |
| 2023 | $4,446 | $539,077 | $227,440 | $311,637 |
| 2022 | $4,181 | $557,064 | $227,144 | $329,920 |
| 2021 | $4,130 | $456,055 | $221,007 | $235,048 |
| 2020 | $4,010 | $412,557 | $201,334 | $211,223 |
| 2019 | $3,582 | $390,636 | $189,042 | $201,594 |
| 2018 | $4,209 | $400,463 | $0 | $0 |
| 2017 | $3,508 | $358,889 | $0 | $0 |
| 2016 | $3,344 | $325,897 | $0 | $0 |
| 2015 | $3,230 | $284,858 | $0 | $0 |
| 2014 | -- | $260,104 | $0 | $0 |
| 2013 | -- | $229,865 | $0 | $0 |
Source: Public Records
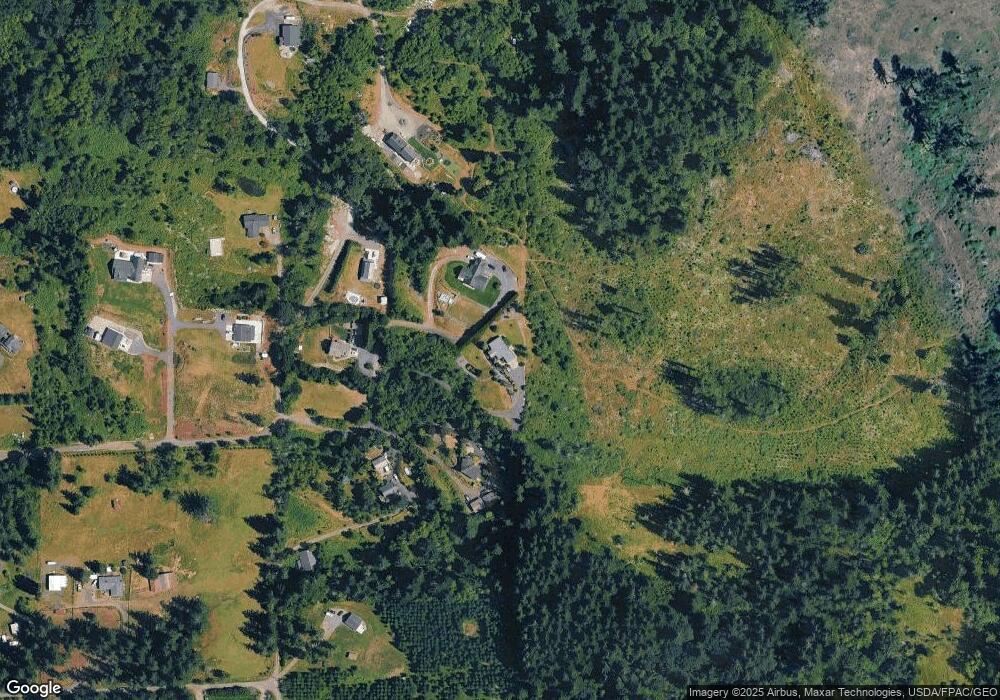
Map
Nearby Homes
- 27120 NE 220th Ave
- 25307 NE 212th Ave
- 0 212th Ave
- 20119 NE 272nd St
- 19619 NE 272nd St
- 20703 NE Basket Flat Rd
- 19428 NE 259th St
- 20607 NE Allworth Rd
- 21821 NE Rock Creek Canyon Rd
- 23417 NE Canyon Rd
- 19601 NE Lucia Falls Rd
- 19815 NE Allworth Rd
- 19606 NE Lucia Falls Rd
- 19301 NE 249th St
- 24020 NE Alvas Rd
- 25815 NE Lucia Falls Rd
- 26101 NE Lucia Falls Rd
- 18308 NE Cole Witter Rd
- 18205 NE 249th St
- 20015 NE 234th St
- 22100 NE 269th St
- 22022 NE 269th St
- 27118 NE 220th Ave
- 22038 NE 266th St
- 27207 NE 220th Ave
- 21818 NE 269th St
- 22101 NE 269th St
- 21914 NE 266th St
- 0 NE 269th St Unit 1280772
- 0 NE 269th St Unit 1280768
- 0 NE 269th St Unit 1280764
- 0 NE 269th St Unit 1842743
- 0 NE 269th St Unit 21128064
- 0 NE 269th St Unit 12411263
- 0 NE 269th St Unit 4030328
- 0 NE 269th St Unit 9046800
- 0 NE 269th St Unit 9073547
- 0 NE 269th St Unit 8004845
- 0 NE 269th St Unit 9086518
- 0 NE 269th St Unit 10059823