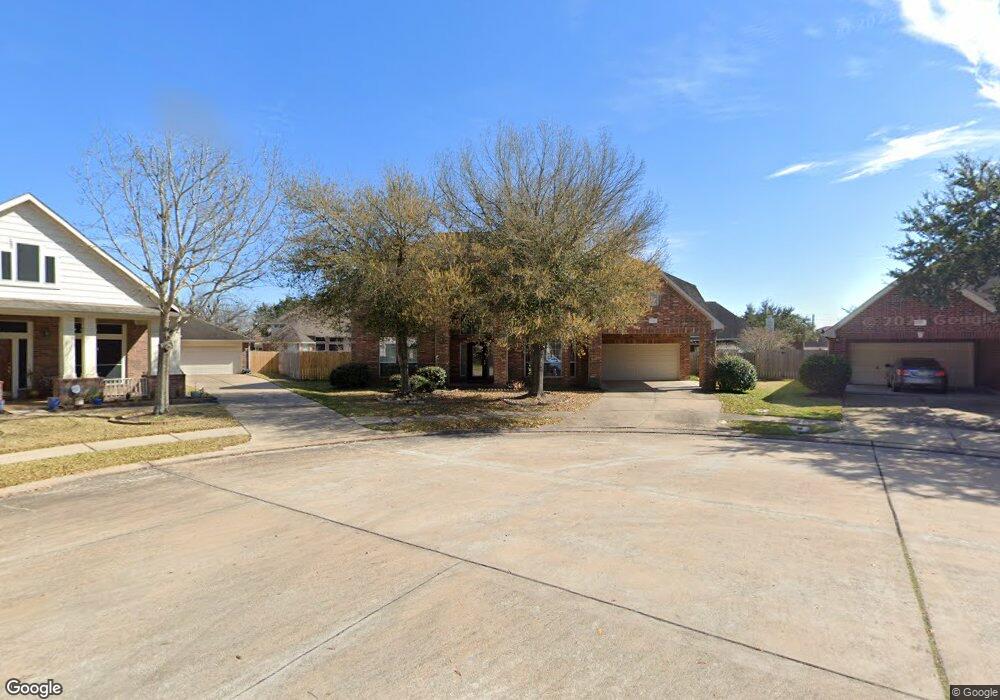
22107 Crossbridge Ln Richmond, TX 77469
Riverpark NeighborhoodEstimated Value: $437,000 - $496,000
4
Beds
4
Baths
4,506
Sq Ft
$106/Sq Ft
Est. Value
About This Home
This home is located at 22107 Crossbridge Ln, Richmond, TX 77469 and is currently estimated at $477,741, approximately $106 per square foot. 22107 Crossbridge Ln is a home located in Fort Bend County with nearby schools including Hutchison Elementary School, J J Wessendorff Middle School, and Lamar Junior High School.
Ownership History
Date
Name
Owned For
Owner Type
Purchase Details
Closed on
Mar 21, 2018
Sold by
Liu Yucheng and Liu Xiulan
Bought by
Liu Yucheng and Liu Xiulan
Current Estimated Value
Purchase Details
Closed on
Jun 21, 2016
Sold by
Deutsche Bank National Trust Company
Bought by
Liu Yucheng and Liu Xiulan
Purchase Details
Closed on
Jan 4, 2011
Sold by
Mclean Roger
Bought by
Deutsche Bank National Trust Company
Purchase Details
Closed on
Jul 11, 2006
Sold by
Mcclean Rogers and Mcclean Annie
Bought by
Liu Yucheng and Xiulan Liu
Purchase Details
Closed on
Feb 23, 2004
Sold by
J Patrick Homes Ltd
Bought by
Mclean Rogers and Mclean Annie
Home Financials for this Owner
Home Financials are based on the most recent Mortgage that was taken out on this home.
Original Mortgage
$252,000
Interest Rate
7.35%
Mortgage Type
Purchase Money Mortgage
Create a Home Valuation Report for This Property
The Home Valuation Report is an in-depth analysis detailing your home's value as well as a comparison with similar homes in the area
Home Values in the Area
Average Home Value in this Area
Purchase History
| Date | Buyer | Sale Price | Title Company |
|---|---|---|---|
| Liu Yucheng | -- | None Available | |
| Liu Yucheng | -- | None Available | |
| Deutsche Bank National Trust Company | $204,850 | None Available | |
| Liu Yucheng | -- | -- | |
| Liu Yucheng | -- | -- | |
| Mclean Rogers | -- | Stewart Title |
Source: Public Records
Mortgage History
| Date | Status | Borrower | Loan Amount |
|---|---|---|---|
| Previous Owner | Mclean Rogers | $252,000 |
Source: Public Records
Tax History Compared to Growth
Tax History
| Year | Tax Paid | Tax Assessment Tax Assessment Total Assessment is a certain percentage of the fair market value that is determined by local assessors to be the total taxable value of land and additions on the property. | Land | Improvement |
|---|---|---|---|---|
| 2025 | $10,105 | $510,761 | $79,235 | $431,526 |
| 2024 | $10,105 | $475,046 | $39,406 | $435,640 |
| 2023 | $9,221 | $431,860 | $0 | $450,428 |
| 2022 | $9,577 | $392,600 | $0 | $393,930 |
| 2021 | $10,260 | $356,910 | $60,950 | $295,960 |
| 2020 | $6,707 | $231,100 | $38,340 | $192,760 |
| 2019 | $10,129 | $334,960 | $57,500 | $277,460 |
| 2018 | $10,153 | $337,990 | $57,500 | $280,490 |
| 2017 | $10,020 | $335,780 | $57,500 | $278,280 |
| 2016 | $10,234 | $342,940 | $57,500 | $285,440 |
| 2015 | $6,308 | $336,260 | $57,500 | $278,760 |
| 2014 | $5,646 | $299,570 | $57,500 | $242,070 |
Source: Public Records
Map
Nearby Homes
- 22011 Larchmont Ct
- 21818 Juniper Wood Ln
- 21814 Juniper Wood Ln
- 22331 Naple Hollow Ln
- 21903 Grand Brook Ln
- 22107 Skyridge Ln
- 22439 Slate Oaks Ln
- 22419 Slate Oaks Ln
- 2143 Ridgefield Park Ln
- 22319 Davenport Downs Ln
- 22418 Mary Rogers Trail
- 22422 Charles Beard Dr
- 8402 Sapphire Sky Ln
- 2007 Clyde Falls Dr
- 22114 Winter Sky Ln
- 22315 Helen Springs Ln
- 22410 Helen Springs Ln
- 2014 Clyde Falls Dr
- 1838 Ryon Falls Dr
- 2414 Hidden Park Ct
- 22111 Crossbridge Ln
- 22102 Crossbridge Ln
- 1919 Grand Willow Ln
- 1927 Grand Willow Ln
- 22115 Crossbridge Ln
- 1911 Grand Willow Ln
- 2003 Grand Willow Ln
- 22106 Crossbridge Ln
- 2011 Grand Willow Ln
- 1905 Grand Willow Ln
- 22110 Crossbridge Ln
- 2015 Grand Willow Ln
- 22114 Crossbridge Ln
- 2019 Grand Willow Ln
- 22011 Grand Willow Ct
- 1918 Grand Willow Ln
- 22111 Stonebriar Ln
- 22010 Grand Willow Ct
- 1914 Grand Willow Ln
- 1919 Autumn Field Ln