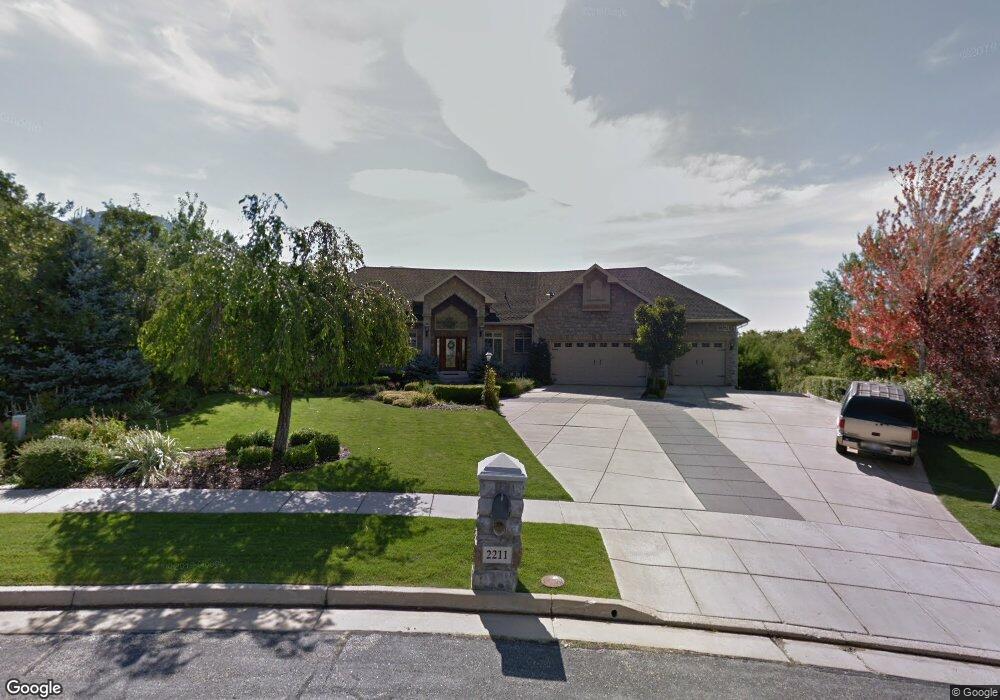
2211 E Shadow Mountain Ln Ogden, UT 84403
Southeast Ogden NeighborhoodEstimated Value: $1,009,000 - $1,208,050
5
Beds
3
Baths
2,856
Sq Ft
$395/Sq Ft
Est. Value
About This Home
This home is located at 2211 E Shadow Mountain Ln, Ogden, UT 84403 and is currently estimated at $1,128,683, approximately $395 per square foot. 2211 E Shadow Mountain Ln is a home located in Weber County with nearby schools including Shadow Valley School, Mount Ogden Junior High School, and Ogden High School.
Ownership History
Date
Name
Owned For
Owner Type
Purchase Details
Closed on
May 6, 2020
Sold by
Clay And Gayle Stucki Family Trust
Bought by
Stucki Clay W
Current Estimated Value
Purchase Details
Closed on
Apr 16, 2020
Sold by
Shadow Mountain Funding Llc
Bought by
Stucki Clay W and Clay And Gayle Stucki Family T
Purchase Details
Closed on
Jan 12, 2010
Sold by
Alder Kathleen W
Bought by
Shadow Mountain Funding Llc
Home Financials for this Owner
Home Financials are based on the most recent Mortgage that was taken out on this home.
Original Mortgage
$699,000
Interest Rate
4.09%
Mortgage Type
Seller Take Back
Purchase Details
Closed on
Sep 27, 2005
Sold by
Alder Richard L and Alder Kathleen W
Bought by
Alder Kathleen W
Create a Home Valuation Report for This Property
The Home Valuation Report is an in-depth analysis detailing your home's value as well as a comparison with similar homes in the area
Home Values in the Area
Average Home Value in this Area
Purchase History
| Date | Buyer | Sale Price | Title Company |
|---|---|---|---|
| Stucki Clay W | -- | None Available | |
| Stucki Clay W | -- | None Available | |
| Shadow Mountain Funding Llc | -- | Lincoln Title Ins Agency | |
| Alder Kathleen W | -- | -- |
Source: Public Records
Mortgage History
| Date | Status | Borrower | Loan Amount |
|---|---|---|---|
| Previous Owner | Shadow Mountain Funding Llc | $699,000 |
Source: Public Records
Tax History
| Year | Tax Paid | Tax Assessment Tax Assessment Total Assessment is a certain percentage of the fair market value that is determined by local assessors to be the total taxable value of land and additions on the property. | Land | Improvement |
|---|---|---|---|---|
| 2025 | $8,651 | $631,353 | $193,605 | $437,748 |
| 2024 | $8,523 | $616,549 | $193,604 | $422,945 |
| 2023 | $8,830 | $649,000 | $193,605 | $455,395 |
| 2022 | $9,226 | $682,550 | $152,398 | $530,152 |
| 2021 | $8,437 | $1,029,000 | $201,373 | $827,627 |
| 2020 | $7,413 | $830,000 | $160,977 | $669,023 |
| 2019 | $7,039 | $741,000 | $160,977 | $580,023 |
| 2018 | $7,950 | $837,163 | $160,977 | $676,186 |
| 2017 | $8,290 | $821,000 | $277,150 | $543,850 |
| 2016 | $8,243 | $443,989 | $88,527 | $355,462 |
| 2015 | $7,703 | $406,034 | $88,527 | $317,507 |
| 2014 | $7,163 | $371,984 | $88,527 | $283,457 |
Source: Public Records
Map
Nearby Homes
- 5538 Elderberry Ct
- 2340 E 5950 S
- 5883 Jared Way
- 1963 Cherokee Cir
- 5304 S Skyline Pkwy
- 2632 E 6025 S
- 1929 E 5625 S
- 5155 Mile High Cir
- 5780 Village Way
- 1880 Shadow Valley Dr
- 6183 S 2375 E
- 5685 S Village Cir
- 5600 Meadow Ln Unit 144
- 5600 Meadow Ln Unit 193
- 2257 E Parkside Cir
- 2291 E Parkside Cir
- 5660 S Meadow Ln Unit 140
- 5630 Meadow Ln Unit 172
- 5630 Meadow Ln Unit 192
- 5973 S South Weber Dr
- 2211 E Shadow Mountain Ln
- 5618 Shadow Mountain Ln
- 5618 Shadow Mountain Ln
- 5613 Shadow Mountain Ln
- 5613 Shadow Mountain Ln Unit 20
- 5613 Shadow Mountain Ln
- 5613 Shadow Mountain Ln
- 2402 Regency Dr
- 2418 Regency Dr
- 5592 Shadow Mountain Ln
- 5592 Shadow Mountain Ln Unit 13
- 5592 Shadow Mountain Ln
- 5638 Dominion Ct
- 2372 Regency Dr
- 5581 Shadow Mountain Ln
- 5581 Shadow Mountain Ln
- 2396 Regency Dr
- 2182 E Shadow Mountain Ln
- 2182 E Shadow Mountain Ln Unit 19
- 2434 Regency Dr
Your Personal Tour Guide
Ask me questions while you tour the home.