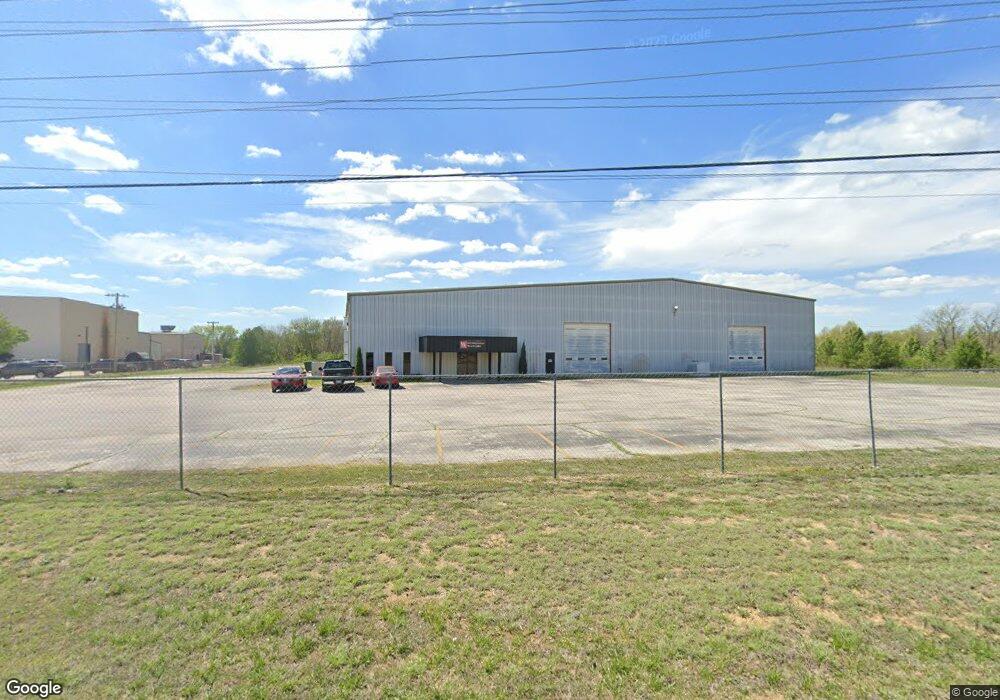
2211 El Anderson Blvd Claremore, OK 74017
Estimated Value: $1,713,404
--
Bed
--
Bath
38,400
Sq Ft
$45/Sq Ft
Est. Value
About This Home
This home is located at 2211 El Anderson Blvd, Claremore, OK 74017 and is currently estimated at $1,713,404, approximately $44 per square foot. 2211 El Anderson Blvd is a home located in Rogers County with nearby schools including Roosa Elementary School, Will Rogers Junior High School, and Claremore High School.
Ownership History
Date
Name
Owned For
Owner Type
Purchase Details
Closed on
Nov 1, 2021
Sold by
2211 Anderson Holdings Llc
Bought by
Scott Thomas Holdings Llc
Current Estimated Value
Home Financials for this Owner
Home Financials are based on the most recent Mortgage that was taken out on this home.
Original Mortgage
$1,190,000
Outstanding Balance
$1,086,425
Interest Rate
2.88%
Mortgage Type
Purchase Money Mortgage
Estimated Equity
$626,979
Purchase Details
Closed on
Oct 20, 2021
Sold by
Witt Family Limited Partnership
Bought by
2211 Anderson Holdings Llc
Home Financials for this Owner
Home Financials are based on the most recent Mortgage that was taken out on this home.
Original Mortgage
$1,190,000
Outstanding Balance
$1,086,425
Interest Rate
2.88%
Mortgage Type
Purchase Money Mortgage
Estimated Equity
$626,979
Purchase Details
Closed on
Oct 16, 2017
Sold by
Witt Jacqueline T
Bought by
Hotchkies Michelle Terese and Jacqueline T Witt Living Trust
Create a Home Valuation Report for This Property
The Home Valuation Report is an in-depth analysis detailing your home's value as well as a comparison with similar homes in the area
Home Values in the Area
Average Home Value in this Area
Purchase History
| Date | Buyer | Sale Price | Title Company |
|---|---|---|---|
| Scott Thomas Holdings Llc | $1,400,000 | Old Republic Natl Ttl Ins Co | |
| 2211 Anderson Holdings Llc | $14,666 | New Title Company Name | |
| Hotchkies Michelle Terese | -- | None Available |
Source: Public Records
Mortgage History
| Date | Status | Borrower | Loan Amount |
|---|---|---|---|
| Open | Scott Thomas Holdings Llc | $1,190,000 |
Source: Public Records
Tax History Compared to Growth
Tax History
| Year | Tax Paid | Tax Assessment Tax Assessment Total Assessment is a certain percentage of the fair market value that is determined by local assessors to be the total taxable value of land and additions on the property. | Land | Improvement |
|---|---|---|---|---|
| 2025 | $7,148 | $77,338 | $11,000 | $66,338 |
| 2024 | $6,807 | $73,655 | $11,000 | $62,655 |
| 2023 | $6,807 | $154,000 | $11,000 | $143,000 |
| 2022 | $13,583 | $146,732 | $11,000 | $135,732 |
| 2021 | $9,444 | $106,950 | $11,000 | $95,950 |
| 2020 | $9,708 | $106,950 | $11,000 | $95,950 |
| 2019 | $9,352 | $106,021 | $11,000 | $95,021 |
| 2018 | $8,886 | $100,972 | $11,000 | $89,972 |
| 2017 | $8,411 | $91,585 | $11,000 | $80,585 |
| 2016 | $8,187 | $87,224 | $11,000 | $76,224 |
| 2015 | $8,088 | $87,224 | $11,000 | $76,224 |
| 2014 | $8,088 | $87,224 | $11,000 | $76,224 |
Source: Public Records
Map
Nearby Homes
- 2403 N Jay St
- 809 W 24th St N
- 825 W 23rd St N
- 817 W 24th St N
- 1005 W 23rd St
- 1908 N Chambers Terrace
- 1012 W 22nd St
- 1110 W 24th St N
- 1103 W 20th St
- 1112 W 20th St
- E E 470 Rd
- 1907 N Chambers Ave
- 1404 Oakhurst Cir
- 0 N J M Davis Blvd
- 401 W Blue Starr Dr
- 1505 Cedarwood Dr
- 1504 Cedarwood Dr
- 1606 N Chambers Terrace
- 1503 Cedarwood Dr
- 1506 Cedarwood Dr
- 802 W 23rd Place N
- 2307 Jay St
- 2555 N Jay St
- 2305 Jay St
- 2303 N Jay St
- 2303 Jay St
- 808 W 24th St N
- 804 W 23rd Place N
- 805 W 23rd St N
- 807 W 23rd St N
- 810 W 24th St N
- 809 W 23rd St N
- 2525 N Jay St
- 2700 N Jay St
- 811 W 23rd St N
- 812 W 24th St N
- 803 W 24th St N
- 802 W 23rd St N
- 0 N Industrial Blvd
- 813 W 23rd St N