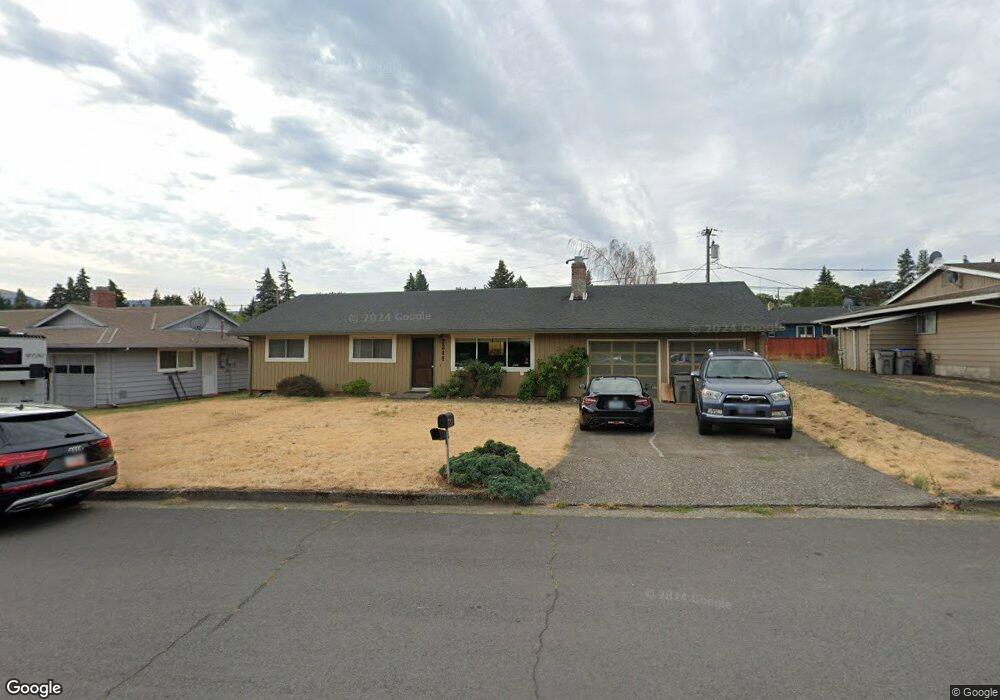
2211 Eugene St Hood River, OR 97031
Estimated Value: $555,881 - $631,000
3
Beds
2
Baths
1,232
Sq Ft
$482/Sq Ft
Est. Value
About This Home
This home is located at 2211 Eugene St, Hood River, OR 97031 and is currently estimated at $593,441, approximately $481 per square foot. 2211 Eugene St is a home located in Hood River County with nearby schools including May Street Elementary School, Hood River Middle School, and Hood River Valley High School.
Ownership History
Date
Name
Owned For
Owner Type
Purchase Details
Closed on
Nov 7, 2013
Sold by
Federal Home Loan Mortgage Corporation
Bought by
Ernst Ryan
Current Estimated Value
Home Financials for this Owner
Home Financials are based on the most recent Mortgage that was taken out on this home.
Original Mortgage
$260,102
Interest Rate
4.32%
Mortgage Type
New Conventional
Purchase Details
Closed on
Aug 6, 2013
Sold by
Badrieh Jamel E
Bought by
Wells Fargo Bank Na
Purchase Details
Closed on
Jul 8, 2013
Sold by
Wells Fargo Bank Na
Bought by
Federal Home Loan Mortgage Corporation
Purchase Details
Closed on
Feb 6, 2007
Sold by
Badrich Jamel E
Bought by
Badrich Jamel E
Home Financials for this Owner
Home Financials are based on the most recent Mortgage that was taken out on this home.
Original Mortgage
$212,000
Interest Rate
6.21%
Mortgage Type
New Conventional
Create a Home Valuation Report for This Property
The Home Valuation Report is an in-depth analysis detailing your home's value as well as a comparison with similar homes in the area
Home Values in the Area
Average Home Value in this Area
Purchase History
| Date | Buyer | Sale Price | Title Company |
|---|---|---|---|
| Ernst Ryan | $254,900 | Amerititle | |
| Wells Fargo Bank Na | $214,240 | None Available | |
| Federal Home Loan Mortgage Corporation | -- | Amerititle | |
| Badrich Jamel E | -- | Amerititle |
Source: Public Records
Mortgage History
| Date | Status | Borrower | Loan Amount |
|---|---|---|---|
| Previous Owner | Ernst Ryan | $260,102 | |
| Previous Owner | Badrich Jamel E | $212,000 |
Source: Public Records
Tax History Compared to Growth
Tax History
| Year | Tax Paid | Tax Assessment Tax Assessment Total Assessment is a certain percentage of the fair market value that is determined by local assessors to be the total taxable value of land and additions on the property. | Land | Improvement |
|---|---|---|---|---|
| 2024 | $3,213 | $214,720 | $143,170 | $71,550 |
| 2023 | $3,213 | $208,470 | $139,000 | $69,470 |
| 2022 | $2,969 | $202,400 | $56,840 | $145,560 |
| 2021 | $2,983 | $196,510 | $55,180 | $141,330 |
| 2020 | $2,884 | $190,790 | $53,580 | $137,210 |
| 2019 | $2,691 | $185,240 | $52,030 | $133,210 |
| 2018 | $2,718 | $179,850 | $50,510 | $129,340 |
| 2017 | $2,577 | $168,610 | $49,040 | $119,570 |
| 2016 | $2,511 | $163,700 | $47,620 | $116,080 |
| 2015 | $2,467 | $158,940 | $46,230 | $112,710 |
| 2014 | $2,429 | $154,320 | $44,890 | $109,430 |
| 2013 | -- | $149,830 | $43,580 | $106,250 |
Source: Public Records
Map
Nearby Homes
- 407 22nd St
- 2260 Sherman Ave
- 2217 Clearwater Ln
- 1826 Armadale Ave
- 440 Sherman Ct
- 201 Selkirk Ln
- 9 N 20th St
- 929 Goose Way
- 3665 May St
- 1804 Lincoln St Unit 1
- 2877 Hazel Ave
- 2455 Belmont Dr
- 2940 Montello Place
- 1534 Solar Ln
- 1111 29th St
- 1105 29th St
- 1534 Lincoln St
- 1250 29th St
- 3852 Belmont Dr
- 3820 Belmont Dr
- 2201 Eugene St
- 2221 Eugene St
- 2234 Montello Ave
- 2218 Montello Ave
- 2212 Eugene St
- 2202 Eugene St
- 2231 Eugene St
- 2234 Eugene St
- 2264 Montello Ave
- 503 22nd St
- 2178 Montello Ave
- 414 22nd St
- 2242 Eugene St
- 2237 Montello Ave
- 2219 Montello Ave
- 2320 Montello Ave
- 2241 Eugene St
- 2167 Eugene St
- 415 22nd St
- 2275 Montello Ave