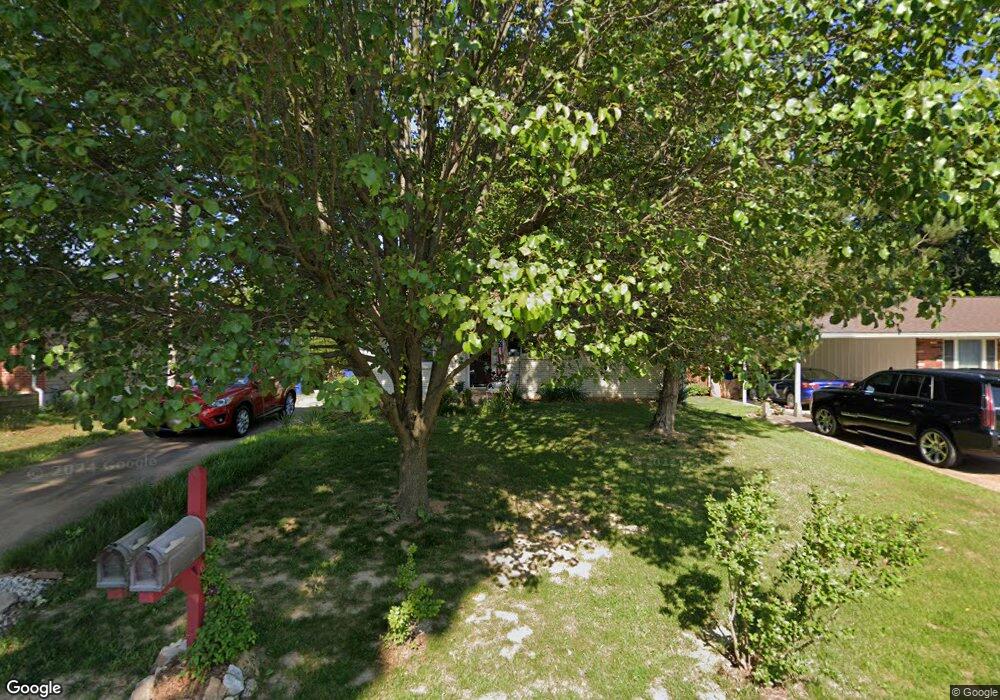
2211 Gladiator Dr Fenton, MO 63026
Estimated Value: $207,267 - $230,000
3
Beds
1
Bath
864
Sq Ft
$256/Sq Ft
Est. Value
About This Home
This home is located at 2211 Gladiator Dr, Fenton, MO 63026 and is currently estimated at $221,567, approximately $256 per square foot. 2211 Gladiator Dr is a home located in St. Louis County with nearby schools including Uthoff Valley Elementary School, Rockwood South Middle School, and Rockwood Summit Senior High School.
Ownership History
Date
Name
Owned For
Owner Type
Purchase Details
Closed on
Oct 20, 2003
Sold by
Chapman C Blair
Bought by
Chapman Betty M and Roy W & Betty M Chapman Revocable Inter
Current Estimated Value
Purchase Details
Closed on
Oct 2, 2003
Sold by
Chapman Betty M
Bought by
Chapman Betty M and Roy W & Betty M Chapman Revocable Inter
Purchase Details
Closed on
Nov 3, 2000
Sold by
Kris Mccurdy and Kris Sarah
Bought by
Chapman C Blair and Chapman Roy
Home Financials for this Owner
Home Financials are based on the most recent Mortgage that was taken out on this home.
Original Mortgage
$85,850
Outstanding Balance
$36,626
Interest Rate
10.12%
Estimated Equity
$184,941
Purchase Details
Closed on
Apr 16, 1997
Sold by
James Stephen L and James Jane Ellen
Bought by
Mccurdy Kris
Create a Home Valuation Report for This Property
The Home Valuation Report is an in-depth analysis detailing your home's value as well as a comparison with similar homes in the area
Home Values in the Area
Average Home Value in this Area
Purchase History
| Date | Buyer | Sale Price | Title Company |
|---|---|---|---|
| Chapman Betty M | -- | -- | |
| Chapman Betty M | -- | -- | |
| Chapman C Blair | -- | -- | |
| Mccurdy Kris | -- | -- |
Source: Public Records
Mortgage History
| Date | Status | Borrower | Loan Amount |
|---|---|---|---|
| Open | Chapman C Blair | $85,850 |
Source: Public Records
Tax History Compared to Growth
Tax History
| Year | Tax Paid | Tax Assessment Tax Assessment Total Assessment is a certain percentage of the fair market value that is determined by local assessors to be the total taxable value of land and additions on the property. | Land | Improvement |
|---|---|---|---|---|
| 2025 | $2,345 | $34,640 | $19,460 | $15,180 |
| 2024 | $2,345 | $31,280 | $16,170 | $15,110 |
| 2023 | $2,343 | $31,280 | $16,170 | $15,110 |
| 2022 | $2,432 | $30,280 | $14,360 | $15,920 |
| 2021 | $2,414 | $30,280 | $14,360 | $15,920 |
| 2020 | $2,275 | $27,420 | $15,660 | $11,760 |
| 2019 | $2,281 | $27,420 | $15,660 | $11,760 |
| 2018 | $1,890 | $21,740 | $12,180 | $9,560 |
| 2017 | $1,875 | $21,740 | $12,180 | $9,560 |
| 2016 | $1,716 | $20,070 | $8,760 | $11,310 |
| 2015 | $1,681 | $20,070 | $8,760 | $11,310 |
| 2014 | $1,686 | $19,630 | $5,360 | $14,270 |
Source: Public Records
Map
Nearby Homes
- 1823 Dover Trace Dr
- 1808 Dover Trace Dr
- 2209 Fenway Farms Trail
- 1719 Chestnut Farms Ct
- 2017 Brutus Ct
- 1655 Valley Park Rd
- 1851 Hawkins Place
- 1107 Coronita Way
- 1818 Charles Thomas Ln
- 161 Majestic Dr
- 88 Lucie Ln
- 1923 Smizer Mill Rd
- 2 Salvation Ridge Ct
- 107 Majestic Dr
- 1800 Harbor Mill Dr
- 1575 Uthoff Dr
- 1881 San Pedro Ln
- 683 Greenholme Ct
- 678 Greensleeves Dr
- 1883 San Lucas Ln
- 2213 Gladiator Dr
- 2209 Gladiator Dr
- 2215 Gladiator Dr
- 2207 Gladiator Dr
- 2208 Gladiator Dr
- 2091 Penncross Ct
- 2210 Gladiator Dr
- 2205 Gladiator Dr
- 2217 Gladiator Dr
- 2212 Gladiator Dr
- 2204 Aventine Dr
- 2093 Penncross Ct
- 2089 Penncross Ct
- 2203 Gladiator Dr
- 2219 Gladiator Dr
- 2214 Gladiator Dr
- 2206 Aventine Dr
- 2203 Aventine Dr
- 2018 Chariot Dr
- 2221 Gladiator Dr