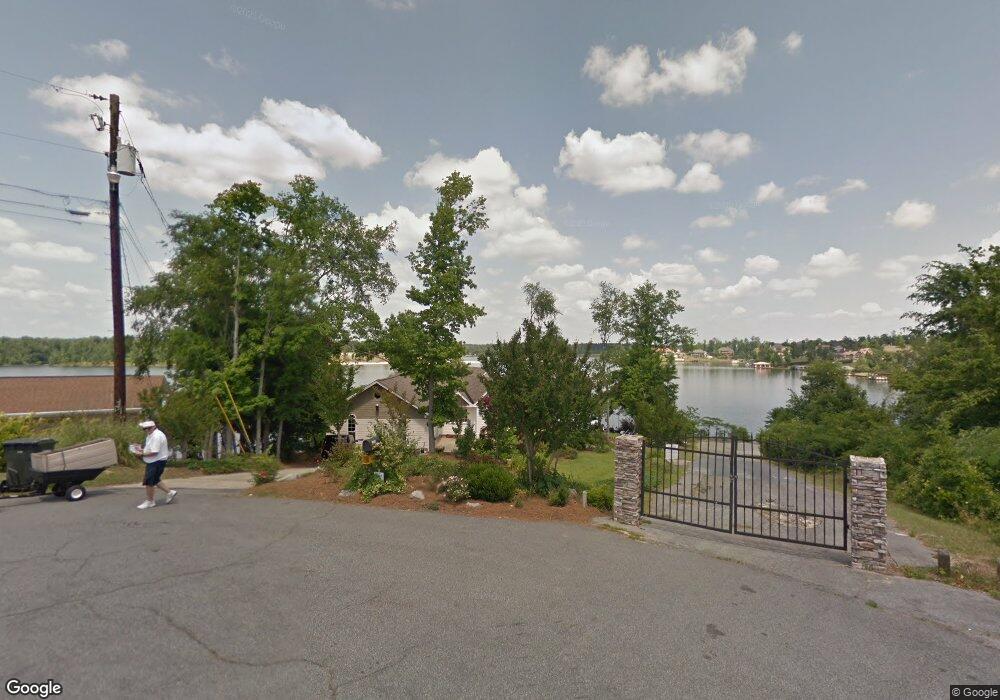
2211 Gwendale Dr W Lizella, GA 31052
Estimated Value: $453,000 - $599,000
4
Beds
4
Baths
2,708
Sq Ft
$187/Sq Ft
Est. Value
About This Home
This home is located at 2211 Gwendale Dr W, Lizella, GA 31052 and is currently estimated at $506,960, approximately $187 per square foot. 2211 Gwendale Dr W is a home located in Bibb County with nearby schools including Skyview Elementary School, Rutland Middle School, and Rutland High School.
Ownership History
Date
Name
Owned For
Owner Type
Purchase Details
Closed on
Jun 23, 2015
Sold by
Jamison Kulstan J
Bought by
Carlton Ady and Carlton Maggie
Current Estimated Value
Home Financials for this Owner
Home Financials are based on the most recent Mortgage that was taken out on this home.
Original Mortgage
$300,000
Outstanding Balance
$233,759
Interest Rate
3.92%
Mortgage Type
Future Advance Clause Open End Mortgage
Estimated Equity
$273,201
Purchase Details
Closed on
May 10, 2013
Sold by
Wellman Thomas H
Bought by
Jamison Kulistan A
Purchase Details
Closed on
Mar 14, 2011
Sold by
Wellman Thomas H and Jamison Kulistan A
Bought by
Wellman Thomas H and Jamison Kulistan A
Purchase Details
Closed on
Nov 30, 2000
Sold by
Wellman Russel E and Elisabeth Galle
Bought by
Wellman Thomas H
Purchase Details
Closed on
Oct 12, 2000
Sold by
Hinekley Ladonna
Bought by
Wellman Thomas H
Create a Home Valuation Report for This Property
The Home Valuation Report is an in-depth analysis detailing your home's value as well as a comparison with similar homes in the area
Home Values in the Area
Average Home Value in this Area
Purchase History
| Date | Buyer | Sale Price | Title Company |
|---|---|---|---|
| Carlton Ady | $450,000 | Attorney | |
| Jamison Kulistan A | -- | None Available | |
| Wellman Thomas H | -- | None Available | |
| Wellman Thomas H | -- | -- | |
| Wellman Thomas H | $245,000 | -- |
Source: Public Records
Mortgage History
| Date | Status | Borrower | Loan Amount |
|---|---|---|---|
| Open | Carlton Ady | $300,000 |
Source: Public Records
Tax History Compared to Growth
Tax History
| Year | Tax Paid | Tax Assessment Tax Assessment Total Assessment is a certain percentage of the fair market value that is determined by local assessors to be the total taxable value of land and additions on the property. | Land | Improvement |
|---|---|---|---|---|
| 2024 | $4,731 | $186,300 | $47,250 | $139,050 |
| 2023 | $4,731 | $186,300 | $47,250 | $139,050 |
| 2022 | $6,186 | $178,686 | $56,520 | $122,166 |
| 2021 | $6,790 | $178,686 | $56,520 | $122,166 |
| 2020 | $6,937 | $178,686 | $56,520 | $122,166 |
| 2019 | $6,609 | $168,842 | $56,520 | $112,322 |
| 2018 | $10,846 | $177,918 | $56,520 | $121,398 |
| 2017 | $6,666 | $177,918 | $56,520 | $121,398 |
| 2016 | $6,155 | $177,918 | $56,520 | $121,398 |
| 2015 | $7,011 | $150,168 | $56,520 | $93,648 |
| 2014 | $4,682 | $150,168 | $56,520 | $93,648 |
Source: Public Records
Map
Nearby Homes
- 2336 Gwendale Dr E
- 2318 Gwendale Dr E
- 2416 Grand Harbour Ct
- 2324 Gwendale Dr W
- 352 Hillridge Cove
- 2306 Grand Harbour Dr
- 2313 Grand Harbour Dr
- 2303 Grand Harbour Dr
- 2317 Grand Harbour Dr
- 2314 Grand Harbour Dr
- 2299 Lake Helen Ct
- 2285 Lake Helen Ct
- 2296 Lake Helen Ct
- 2294 Lake Helen Ct
- 2293 Lake Helen Ct
- 349 Hillridge Cove
- 509 Spring Run
- 513 Spring Run
- 508 Spring Run
- 505 Spring Run
- 2237 Gwendale Dr W
- 2236 Gwendale Dr W
- 2249 Gwendale Dr W
- 2344 Gwendale Dr E
- 2328 Gwendale Dr E
- 2348 Gwendale Dr E Unit 212
- 2261 Gwendale Dr W
- 2225 Lake Haven Ct
- 2308 Gwendale Dr E Unit 103-79
- 2308 Gwendale Dr E
- 2270 Gwendale Dr W
- 2290 Gwendale Dr W
- 2290 Gwendale Dr
- 2302 Gwendale Dr E
- 2339 Gwendale Dr E
- 2424 Grand Harbour Ct
- 2237 Lake Haven Ct
- 2331 Gwendale Dr E
- 2420 Grand Harbour Ct
- 2321 Gwendale Dr E