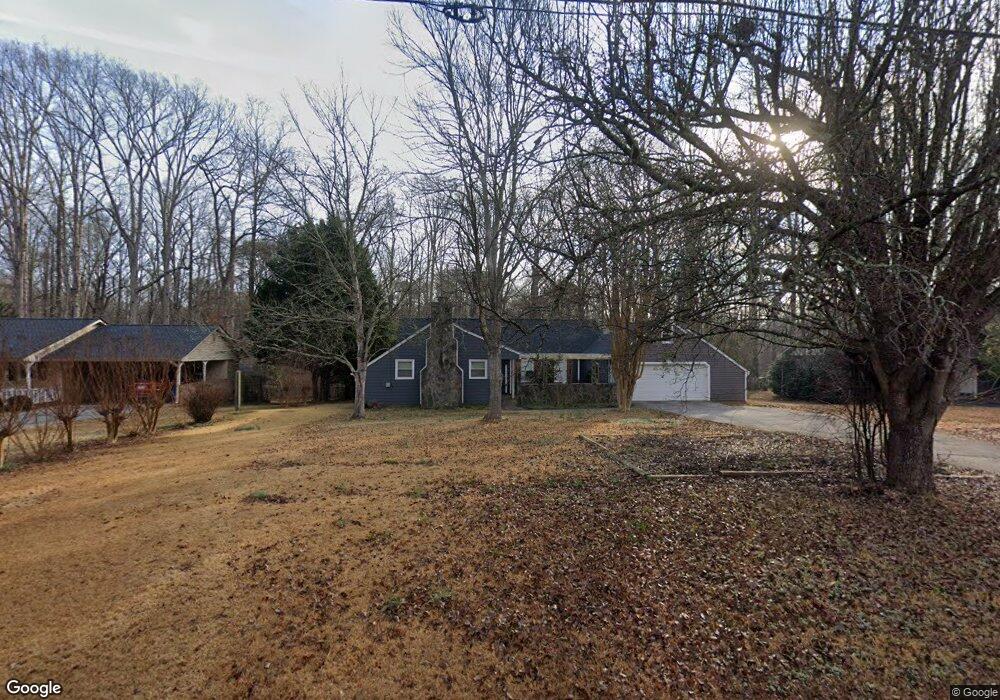
2211 Honeybee Creek Dr Griffin, GA 30224
Spalding County NeighborhoodEstimated Value: $277,752 - $370,000
4
Beds
3
Baths
3,612
Sq Ft
$87/Sq Ft
Est. Value
About This Home
This home is located at 2211 Honeybee Creek Dr, Griffin, GA 30224 and is currently estimated at $312,688, approximately $86 per square foot. 2211 Honeybee Creek Dr is a home located in Spalding County with nearby schools including Crescent Road Elementary School, Rehoboth Road Middle School, and Spalding High School.
Ownership History
Date
Name
Owned For
Owner Type
Purchase Details
Closed on
Dec 3, 2019
Sold by
Burford Tanner Drake
Bought by
Douglas Oral and Blue Shalyce
Current Estimated Value
Home Financials for this Owner
Home Financials are based on the most recent Mortgage that was taken out on this home.
Original Mortgage
$191,468
Outstanding Balance
$168,473
Interest Rate
3.5%
Mortgage Type
FHA
Estimated Equity
$144,215
Purchase Details
Closed on
Feb 7, 2019
Sold by
Long William Hugh
Bought by
Burford Tanner Blake
Home Financials for this Owner
Home Financials are based on the most recent Mortgage that was taken out on this home.
Original Mortgage
$34,000
Interest Rate
4.4%
Mortgage Type
New Conventional
Purchase Details
Closed on
Mar 1, 2018
Sold by
Manning
Bought by
Long William Hugh
Purchase Details
Closed on
Mar 28, 2011
Sold by
Hud-Housing Of Urban Dev
Bought by
Sams Cynthia and Manning Richard
Purchase Details
Closed on
Jun 1, 2010
Sold by
Pnc Bk National Assn
Bought by
Hud-Housing Of Urban Dev
Purchase Details
Closed on
May 8, 2006
Sold by
Skinner H Bruce and Skinner Katherine
Bought by
Butler Michael S and Butler Michael E
Home Financials for this Owner
Home Financials are based on the most recent Mortgage that was taken out on this home.
Original Mortgage
$136,754
Interest Rate
6.33%
Mortgage Type
FHA
Purchase Details
Closed on
Jun 1, 1998
Sold by
Sartain James P and Sartain Joan E
Bought by
Skinner Katherine M
Home Financials for this Owner
Home Financials are based on the most recent Mortgage that was taken out on this home.
Original Mortgage
$111,610
Interest Rate
7.15%
Mortgage Type
New Conventional
Purchase Details
Closed on
Oct 18, 1988
Sold by
Cruse Winston David and Lynn Lee
Bought by
Sartain James Paul and Joan Elaine
Purchase Details
Closed on
Jun 30, 1986
Sold by
Cruse William David and Lynn Lee
Bought by
Cruse Winston David and Lynn Lee
Purchase Details
Closed on
Jun 6, 1986
Sold by
Brantley Brantley C and Brantley Rebecca B
Bought by
Cruse William David and Lynn Lee
Purchase Details
Closed on
May 7, 1979
Sold by
Johnson Johnson K and Johnson L
Bought by
Brantley Brantley C and Brantley Rebecca B
Purchase Details
Closed on
Dec 14, 1978
Sold by
Jones David R and Jones Sybil N
Bought by
Johnson Johnson D and Johnson L
Purchase Details
Closed on
Aug 29, 1974
Sold by
Bonner Jerry D
Bought by
Jones David R and Jones Sybil N
Purchase Details
Closed on
Jul 23, 1973
Sold by
Jones Maurice E and Jones Mickey M
Bought by
Bonner Jerry D
Create a Home Valuation Report for This Property
The Home Valuation Report is an in-depth analysis detailing your home's value as well as a comparison with similar homes in the area
Home Values in the Area
Average Home Value in this Area
Purchase History
| Date | Buyer | Sale Price | Title Company |
|---|---|---|---|
| Douglas Oral | $195,000 | -- | |
| Burford Tanner Blake | $34,000 | -- | |
| Long William Hugh | -- | -- | |
| Long William Hugh | $30,000 | -- | |
| Sams Cynthia | -- | -- | |
| Hud-Housing Of Urban Dev | -- | -- | |
| Pnc Bk National Assn | $151,898 | -- | |
| Butler Michael S | $138,900 | -- | |
| Skinner Katherine M | $110,000 | -- | |
| Sartain James Paul | $85,000 | -- | |
| Cruse Winston David | -- | -- | |
| Cruse William David | $78,500 | -- | |
| Brantley Brantley C | $55,600 | -- | |
| Johnson Johnson D | $18,800 | -- | |
| Jones David R | $48,500 | -- | |
| Bonner Jerry D | $3,400 | -- |
Source: Public Records
Mortgage History
| Date | Status | Borrower | Loan Amount |
|---|---|---|---|
| Open | Douglas Oral | $191,468 | |
| Previous Owner | Burford Tanner Blake | $34,000 | |
| Previous Owner | Butler Michael S | $136,754 | |
| Previous Owner | Skinner Katherine M | $111,610 |
Source: Public Records
Tax History Compared to Growth
Tax History
| Year | Tax Paid | Tax Assessment Tax Assessment Total Assessment is a certain percentage of the fair market value that is determined by local assessors to be the total taxable value of land and additions on the property. | Land | Improvement |
|---|---|---|---|---|
| 2024 | $4,037 | $114,652 | $11,400 | $103,252 |
| 2023 | $4,037 | $114,652 | $11,400 | $103,252 |
| 2022 | $3,550 | $99,451 | $10,000 | $89,451 |
| 2021 | $2,979 | $83,731 | $10,000 | $73,731 |
| 2020 | $2,838 | $77,766 | $10,000 | $67,766 |
| 2019 | $2,836 | $76,188 | $10,000 | $66,188 |
| 2018 | $1,757 | $45,989 | $10,000 | $35,989 |
| 2017 | $1,724 | $46,363 | $10,000 | $36,363 |
| 2016 | $1,695 | $44,805 | $10,000 | $34,805 |
| 2015 | $1,746 | $44,805 | $10,000 | $34,805 |
| 2014 | $1,781 | $44,805 | $10,000 | $34,805 |
Source: Public Records
Map
Nearby Homes
- 2203 Honeybee Creek Dr
- 0 Sweetbriar Ln Unit B 20110670
- 0 Cedardale Dr Unit 10272855
- TRACT D Cedardale Drive Sweetbriar Ln
- 1 Sweetbriar Ln Unit A
- 2105 Honeybee Creek Dr
- 1022 Waverly Dr
- 1058 Waverly Dr
- LOT 48 Waverly Dr Unit 1
- LOT 47 Waverly Dr Unit 1
- LOT 69 Waverly Dr Unit 1
- LOT 68 Waverly Dr Unit 1
- LOT 67 Waverly Dr Unit 1
- LOT 66 Waverly Dr Unit 1
- LOT 65 Waverly Dr Unit 1
- LOT 46 Waverly Dr Unit 1
- LOT 45 Waverly Dr Unit 1
- LOT 44 Waverly Dr Unit 1
- LOT 43 Waverly Dr Unit 1
- LOT 42 Waverly Dr Unit 1
- 2209 Honeybee Creek Dr
- 2213 Honeybee Creek Dr Unit 1
- 2207 Honeybee Creek Dr
- 2215 Honeybee Creek Dr Unit 1
- 2208 Honeybee Creek Dr
- 2212 Honeybee Dr
- 2212 Honeybee Creek Dr
- 2206 Honeybee Creek Dr Unit 1
- 2205 Honeybee Creek Dr Unit 1
- 2217 Honeybee Creek Dr
- 2214 Honeybee Creek Dr
- 2204 Honeybee Creek Dr
- 2219 Honeybee Creek Dr
- 2216 Honeybee Creek Dr
- 2202 Honeybee Creek Dr
- 302 Cedardale Dr
- 304 Cedardale Dr Unit 4
- 300 Cedardale Dr
- 306 Cedardale Dr
- 298 Cedardale Dr