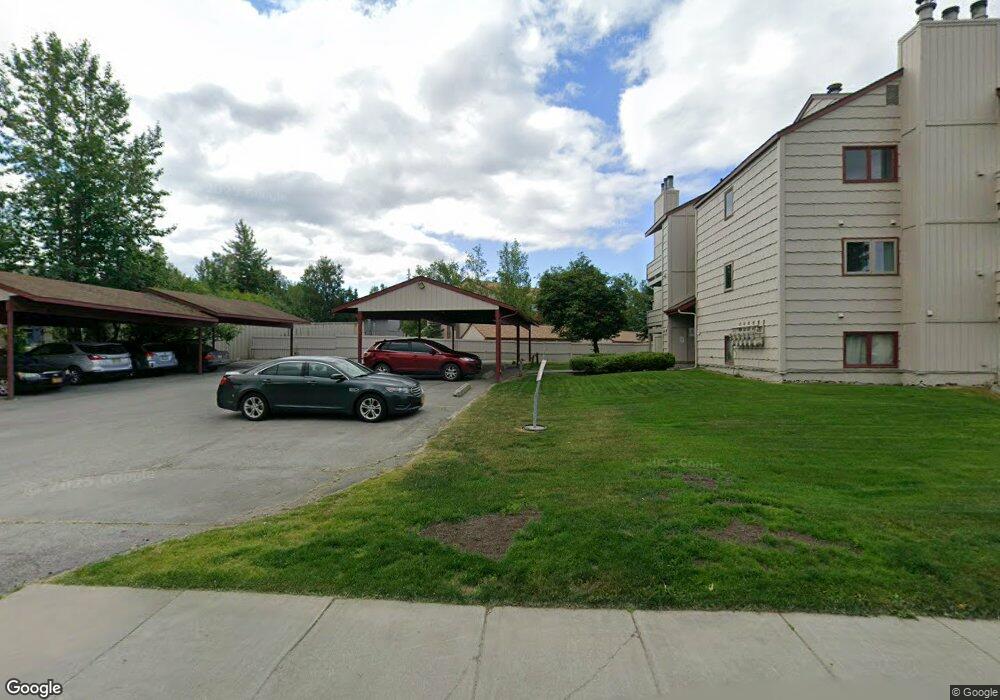
2211 Sentry Dr Anchorage, AK 99507
Abbott Loop NeighborhoodEstimated Value: $142,000 - $204,064
1
Bed
1
Bath
900
Sq Ft
$197/Sq Ft
Est. Value
About This Home
This home is located at 2211 Sentry Dr, Anchorage, AK 99507 and is currently estimated at $177,688, approximately $197 per square foot. 2211 Sentry Dr is a home located in Anchorage Municipality with nearby schools including Spring Hill Elementary School, Hanshew Middle School, and Service High School.
Ownership History
Date
Name
Owned For
Owner Type
Purchase Details
Closed on
Dec 8, 2020
Sold by
Sherwood Todd
Bought by
Greenup Kayla N
Current Estimated Value
Home Financials for this Owner
Home Financials are based on the most recent Mortgage that was taken out on this home.
Original Mortgage
$104,800
Outstanding Balance
$93,044
Interest Rate
2.8%
Mortgage Type
New Conventional
Estimated Equity
$84,644
Purchase Details
Closed on
Jul 16, 2013
Sold by
Hasegawa James H
Bought by
Sherwood Todd
Home Financials for this Owner
Home Financials are based on the most recent Mortgage that was taken out on this home.
Original Mortgage
$124,476
Interest Rate
4.46%
Mortgage Type
VA
Purchase Details
Closed on
Dec 21, 2005
Sold by
Hasegawa Steven H and Hasegawa Ikuko
Bought by
Hasegawa James H
Home Financials for this Owner
Home Financials are based on the most recent Mortgage that was taken out on this home.
Original Mortgage
$92,000
Interest Rate
6.36%
Mortgage Type
Seller Take Back
Create a Home Valuation Report for This Property
The Home Valuation Report is an in-depth analysis detailing your home's value as well as a comparison with similar homes in the area
Home Values in the Area
Average Home Value in this Area
Purchase History
| Date | Buyer | Sale Price | Title Company |
|---|---|---|---|
| Greenup Kayla N | -- | None Listed On Document | |
| Sherwood Todd | -- | Stewart Title Company | |
| Hasegawa James H | -- | None Available | |
| Hasegawa Steven H | -- | None Available |
Source: Public Records
Mortgage History
| Date | Status | Borrower | Loan Amount |
|---|---|---|---|
| Open | Greenup Kayla N | $104,800 | |
| Previous Owner | Sherwood Todd | $124,476 | |
| Previous Owner | Hasegawa James H | $92,000 |
Source: Public Records
Tax History Compared to Growth
Tax History
| Year | Tax Paid | Tax Assessment Tax Assessment Total Assessment is a certain percentage of the fair market value that is determined by local assessors to be the total taxable value of land and additions on the property. | Land | Improvement |
|---|---|---|---|---|
| 2025 | $2,574 | $190,000 | -- | $190,000 |
| 2024 | $2,574 | $159,400 | $0 | $159,400 |
| 2023 | $2,512 | $147,500 | $0 | $147,500 |
| 2022 | $2,482 | $147,400 | $0 | $147,400 |
| 2021 | $2,332 | $129,400 | $0 | $129,400 |
| 2020 | $1,821 | $134,100 | $0 | $134,100 |
| 2019 | $1,699 | $129,800 | $0 | $129,800 |
| 2018 | $1,791 | $136,500 | $0 | $136,500 |
| 2017 | $1,834 | $130,100 | $0 | $130,100 |
| 2016 | $1,806 | $124,300 | $0 | $124,300 |
| 2015 | $1,806 | $122,500 | $0 | $122,500 |
| 2014 | $1,806 | $115,700 | $0 | $115,700 |
Source: Public Records
Map
Nearby Homes
- 9830 Reliance Dr
- 9730 Vanguard Dr Unit 12
- 9710 Vanguard Dr Unit 80
- 9700 Vanguard Dr Unit 70
- 9130 Golovin St
- 2060 Sturbridge Cir
- 1917 Colony Place Unit 33
- 1914 Sturbridge Ct Unit 3
- 10260 Jamestown Dr Unit A8
- 8000 Independence Park Dr
- 267 Loop Unit 267
- 10359 Valley Park Dr
- 9599 Brayton Dr Unit 422
- 1900-1941 Marthas Vineyard Cir
- 9499 Brayton Dr Unit 39
- 9499 Brayton Dr Unit 152
- 9499 Brayton Dr Unit 245
- 1611 Betula Cir
- 10261 Arborvitae Dr
- 10285 Arborvitae Dr
- 2211 Sentry Dr Unit B6
- 2211 Sentry Dr
- 2211 Sentry Dr Unit 8
- 2211 Sentry Dr Unit 6
- 2211 Sentry Dr Unit 1B
- 2211 Sentry Dr Unit B4
- 2211 Sentry Dr Unit B-3
- 2211 Sentry Dr Unit B-5
- 2211 Sentry Dr Unit B-8
- 2211 Sentry Dr Unit B11
- 2211 Sentry Dr Unit 4B
- 2211 Sentry Dr Unit B7
- 2211 Sentry Dr Unit 10
- 2211 Sentry Dr Unit B12
- L11 B4 Sentry Dr
- 9645 Independence Dr
- 9645 Independence Dr
- 9645 Independence Dr
- 9645 Independence Dr
- 9645 Independence Dr