Estimated Value: $379,389 - $410,000
4
Beds
3
Baths
2,349
Sq Ft
$167/Sq Ft
Est. Value
About This Home
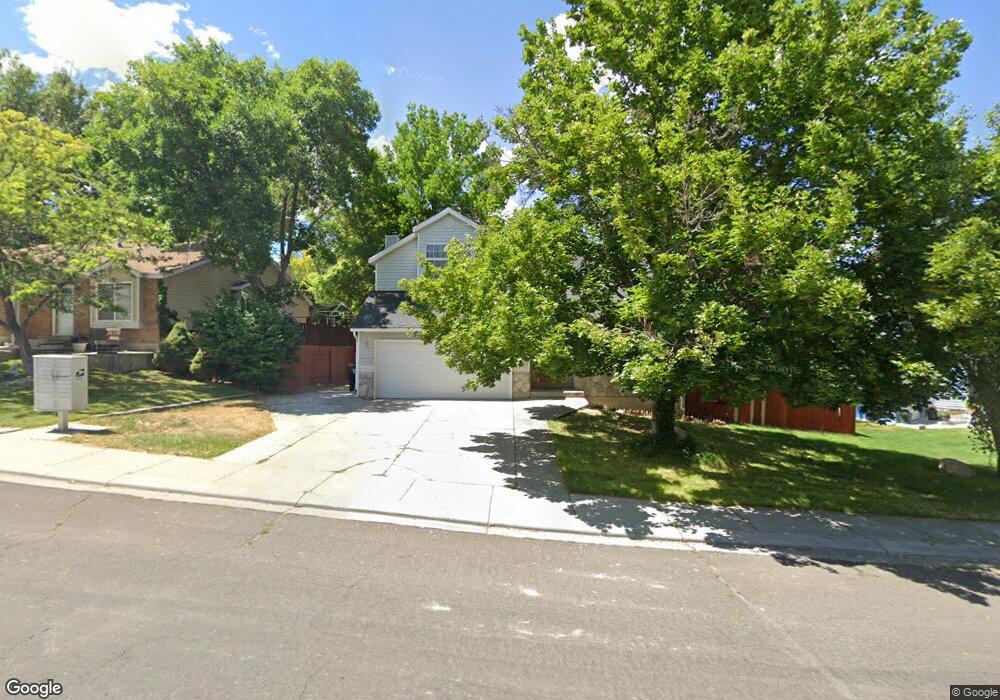
This home is located at 2211 Sierra Dr, Elko, NV 89801 and is currently estimated at $393,097, approximately $167 per square foot. 2211 Sierra Dr is a home located in Elko County with nearby schools including Mountain View Elementary School, Adobe Middle School, and Flagview Intermediate School.
Ownership History
Date
Name
Owned For
Owner Type
Purchase Details
Closed on
Feb 18, 2022
Sold by
Moses Michael R and Moses Christina J
Bought by
Quiala Jose Priante and Quiala Tiara Mercedes
Current Estimated Value
Home Financials for this Owner
Home Financials are based on the most recent Mortgage that was taken out on this home.
Original Mortgage
$310,400
Outstanding Balance
$289,493
Interest Rate
3.92%
Mortgage Type
New Conventional
Estimated Equity
$103,604
Purchase Details
Closed on
Jul 23, 2019
Sold by
Barker Gregory S and Barker Memori
Bought by
Moses Michael R and Moses Christina J
Home Financials for this Owner
Home Financials are based on the most recent Mortgage that was taken out on this home.
Original Mortgage
$260,200
Interest Rate
3.8%
Mortgage Type
FHA
Purchase Details
Closed on
Aug 25, 2016
Sold by
Barker Gregory S and Barker Memori
Bought by
Barker Gregory S and Barker Memori
Create a Home Valuation Report for This Property
The Home Valuation Report is an in-depth analysis detailing your home's value as well as a comparison with similar homes in the area
Home Values in the Area
Average Home Value in this Area
Purchase History
| Date | Buyer | Sale Price | Title Company |
|---|---|---|---|
| Quiala Jose Priante | $320,000 | Stewart Title Guaranty Company | |
| Moses Michael R | $265,000 | Stewart Title Company | |
| Barker Gregory S | -- | None Available |
Source: Public Records
Mortgage History
| Date | Status | Borrower | Loan Amount |
|---|---|---|---|
| Open | Quiala Jose Priante | $310,400 | |
| Previous Owner | Moses Michael R | $260,200 | |
| Closed | Quiala Jose Priante | $9,600 |
Source: Public Records
Tax History Compared to Growth
Tax History
| Year | Tax Paid | Tax Assessment Tax Assessment Total Assessment is a certain percentage of the fair market value that is determined by local assessors to be the total taxable value of land and additions on the property. | Land | Improvement |
|---|---|---|---|---|
| 2025 | $2,406 | $70,292 | $19,950 | $50,342 |
| 2024 | $2,406 | $65,684 | $14,875 | $50,810 |
| 2023 | $2,218 | $63,061 | $14,875 | $48,186 |
| 2022 | $2,053 | $56,051 | $14,875 | $41,176 |
| 2021 | $1,911 | $55,404 | $14,875 | $40,529 |
| 2020 | $1,866 | $53,641 | $12,250 | $41,391 |
| 2019 | $1,801 | $51,683 | $12,250 | $39,433 |
| 2018 | $1,817 | $52,157 | $12,250 | $39,907 |
| 2017 | $1,804 | $51,777 | $12,250 | $39,527 |
| 2016 | $1,833 | $52,340 | $12,250 | $40,090 |
| 2015 | $1,823 | $52,636 | $12,250 | $40,386 |
| 2014 | $1,829 | $50,971 | $12,250 | $38,721 |
Source: Public Records
Map
Nearby Homes
- 1951 Sierra Dr
- 2043 Sierra Dr
- 2607 Platinum Dr
- TBD Spruce Rd
- 2320 N 5th St
- 2503 5th St
- 2505 5th St
- 998 Northside Dr
- 2206 Clearwater Ct
- 3346 Carlson Ave
- 611 Chris Ave
- 2621 Platinum Dr
- 2623 Platinum Dr
- 202 Forest Ln
- 2612 Platinum Dr
- 072006013 Walnut St
- 2970 Aria Way
- 2966 Aria Way
- 0 Interstate 80
- 2918 Aria Way