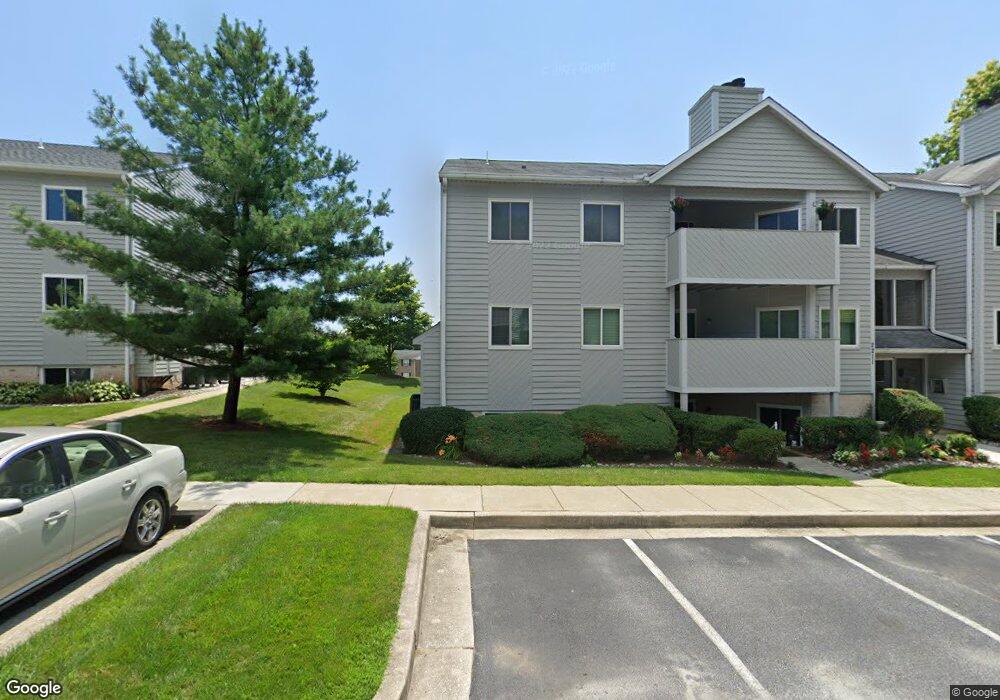
2211G Lowells Glen Rd Baltimore, MD 21234
Estimated Value: $189,000 - $213,000
--
Bed
1
Bath
1,044
Sq Ft
$192/Sq Ft
Est. Value
About This Home
This home is located at 2211G Lowells Glen Rd, Baltimore, MD 21234 and is currently estimated at $200,766, approximately $192 per square foot. 2211G Lowells Glen Rd is a home located in Baltimore County with nearby schools including Harford Hills Elementary School, Pine Grove Middle School, and Loch Raven High.
Ownership History
Date
Name
Owned For
Owner Type
Purchase Details
Closed on
Nov 30, 2021
Sold by
Yip Kimberly P
Bought by
Moulden Bonita L
Current Estimated Value
Home Financials for this Owner
Home Financials are based on the most recent Mortgage that was taken out on this home.
Original Mortgage
$8,500
Outstanding Balance
$7,819
Interest Rate
3.12%
Mortgage Type
Future Advance Clause Open End Mortgage
Estimated Equity
$192,947
Purchase Details
Closed on
Jan 15, 2019
Sold by
Barnum Peter H and Barnum Donna M
Bought by
Yip Kimberly P
Home Financials for this Owner
Home Financials are based on the most recent Mortgage that was taken out on this home.
Original Mortgage
$7,500
Interest Rate
4.6%
Mortgage Type
Stand Alone Second
Purchase Details
Closed on
May 30, 2012
Sold by
Kiaunis Norman P and Wolinski Missy
Bought by
Barnum Peter H and Barnum Donna M
Purchase Details
Closed on
Oct 10, 1988
Sold by
Satyrs Green Cor Poration
Bought by
Kiaunis Madeline A
Create a Home Valuation Report for This Property
The Home Valuation Report is an in-depth analysis detailing your home's value as well as a comparison with similar homes in the area
Home Values in the Area
Average Home Value in this Area
Purchase History
| Date | Buyer | Sale Price | Title Company |
|---|---|---|---|
| Moulden Bonita L | $168,000 | Sage Title Group Llc | |
| Yip Kimberly P | $121,000 | Universal Title | |
| Barnum Peter H | $120,000 | Tower Title Corporation | |
| Kiaunis Madeline A | $84,700 | -- |
Source: Public Records
Mortgage History
| Date | Status | Borrower | Loan Amount |
|---|---|---|---|
| Open | Moulden Bonita L | $8,500 | |
| Open | Moulden Bonita L | $164,957 | |
| Previous Owner | Yip Kimberly P | $7,500 |
Source: Public Records
Tax History Compared to Growth
Tax History
| Year | Tax Paid | Tax Assessment Tax Assessment Total Assessment is a certain percentage of the fair market value that is determined by local assessors to be the total taxable value of land and additions on the property. | Land | Improvement |
|---|---|---|---|---|
| 2025 | $2,798 | $164,000 | $40,000 | $124,000 |
| 2024 | $2,798 | $152,333 | $0 | $0 |
| 2023 | $1,343 | $140,667 | $0 | $0 |
| 2022 | $2,557 | $129,000 | $40,000 | $89,000 |
| 2021 | $2,305 | $127,333 | $0 | $0 |
| 2020 | $1,523 | $125,667 | $0 | $0 |
| 2019 | $1,503 | $124,000 | $40,000 | $84,000 |
| 2018 | $2,348 | $119,333 | $0 | $0 |
| 2017 | $2,084 | $114,667 | $0 | $0 |
| 2016 | $1,648 | $110,000 | $0 | $0 |
| 2015 | $1,648 | $110,000 | $0 | $0 |
| 2014 | $1,648 | $110,000 | $0 | $0 |
Source: Public Records
Map
Nearby Homes
- 6 Tigreff Ct
- 4 Roger Valley Ct
- 3954 Forest Valley Rd
- 71 Roger Valley Ct
- 2314 Covered Bridge Garth
- 9108 Satyr Hill Rd
- 1900 Mountain Ave
- 16 Pinecone Ct
- 9 Pinecone Ct
- 2615 Proctor Ln
- 2621A Proctor Ln
- 9028 Old Harford Rd
- 1905 Haverhill Rd
- 8808 Littlewood Rd
- 8729B Old Harford Rd
- 2501 Harwood Rd
- 8809 Wolverton Rd
- 46 Eastford Ct
- 8613A Quentin Ave
- 2618 Luiss Deane Dr
- 2211K Lowells Glen Rd
- 2211H Lowells Glen Rd
- 2211C Lowells Glen Rd
- 2213 Lowells Glen Rd Unit H
- 2211 Lowells Glen Rd Unit F
- 2213 Lowells Glen Rd Unit L
- 2213 Lowells Glen Rd Unit E
- 2213 Lowells Glen Rd Unit H
- 2213 Lowells Glen Rd Unit K
- 2213 Lowells Glen Rd Unit I
- 2213 Lowells Glen Rd Unit F
- 2213 Lowells Glen Rd Unit G
- 2213 Lowells Glen Rd Unit D
- 2213 Lowells Glen Rd Unit A
- 2213 Lowells Glen Rd Unit B
- 2213 Lowells Glen Rd Unit J
- 2213 Lowells Glen Rd Unit C
- 2213 Lowells Glen Rd
- 2213 Lowells Glen Rd Unit B
- 2211 Lowells Glen Rd Unit J