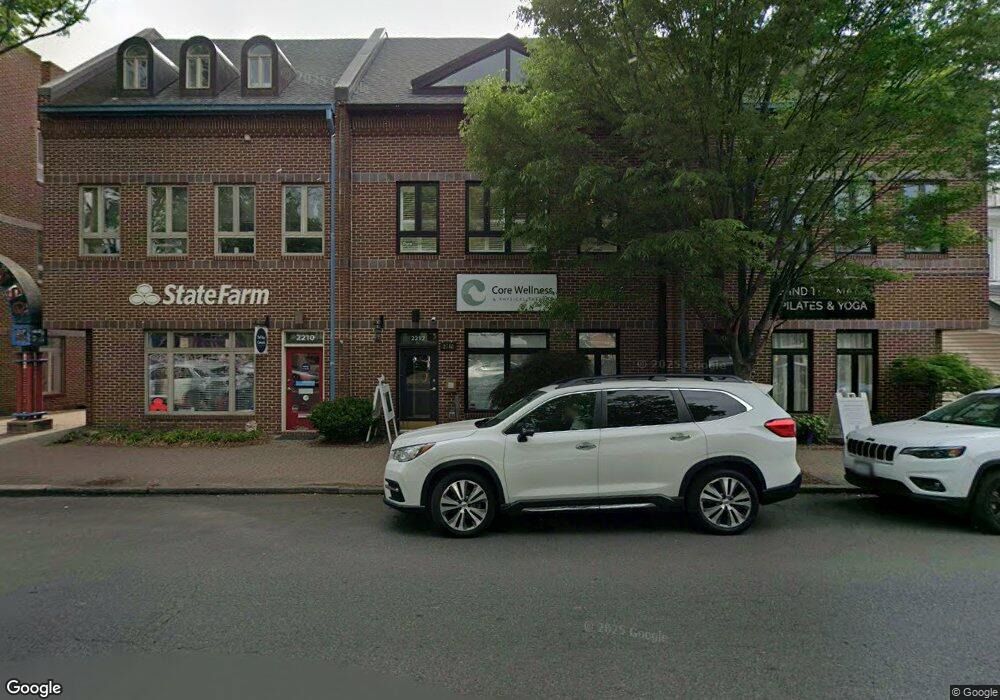
2212 Mount Vernon Ave Alexandria, VA 22301
Del Ray NeighborhoodEstimated Value: $1,309,484
--
Bed
--
Bath
3,300
Sq Ft
$397/Sq Ft
Est. Value
About This Home
This home is located at 2212 Mount Vernon Ave, Alexandria, VA 22301 and is currently estimated at $1,309,484, approximately $396 per square foot. 2212 Mount Vernon Ave is a home located in Alexandria City with nearby schools including Mount Vernon Community School, George Washington Middle School, and Alexandria City High School.
Ownership History
Date
Name
Owned For
Owner Type
Purchase Details
Closed on
Aug 31, 2018
Sold by
Hampshire Properties Llc
Bought by
Cwpt Holdings Llc
Current Estimated Value
Home Financials for this Owner
Home Financials are based on the most recent Mortgage that was taken out on this home.
Original Mortgage
$709,600
Outstanding Balance
$617,539
Interest Rate
4.5%
Mortgage Type
Commercial
Estimated Equity
$691,945
Purchase Details
Closed on
Jun 24, 2003
Sold by
O T V Inc
Bought by
Hampshire Properties
Home Financials for this Owner
Home Financials are based on the most recent Mortgage that was taken out on this home.
Original Mortgage
$360,000
Interest Rate
5.71%
Mortgage Type
Commercial
Create a Home Valuation Report for This Property
The Home Valuation Report is an in-depth analysis detailing your home's value as well as a comparison with similar homes in the area
Home Values in the Area
Average Home Value in this Area
Purchase History
| Date | Buyer | Sale Price | Title Company |
|---|---|---|---|
| Cwpt Holdings Llc | $887,000 | Chicago Title | |
| Hampshire Properties | $450,000 | -- |
Source: Public Records
Mortgage History
| Date | Status | Borrower | Loan Amount |
|---|---|---|---|
| Open | Cwpt Holdings Llc | $709,600 | |
| Previous Owner | Hampshire Properties | $360,000 |
Source: Public Records
Tax History Compared to Growth
Tax History
| Year | Tax Paid | Tax Assessment Tax Assessment Total Assessment is a certain percentage of the fair market value that is determined by local assessors to be the total taxable value of land and additions on the property. | Land | Improvement |
|---|---|---|---|---|
| 2025 | $9,867 | $841,500 | $213,430 | $628,070 |
| 2024 | $9,867 | $841,500 | $213,430 | $628,070 |
| 2023 | $9,341 | $841,500 | $213,430 | $628,070 |
| 2022 | $8,791 | $792,000 | $213,430 | $578,570 |
| 2021 | $7,877 | $709,623 | $191,231 | $518,392 |
| 2020 | $8,081 | $709,623 | $191,231 | $518,392 |
| 2019 | $7,863 | $695,843 | $187,616 | $508,227 |
| 2018 | $7,489 | $662,699 | $178,673 | $484,026 |
| 2017 | $7,341 | $649,688 | $175,153 | $474,535 |
| 2016 | $6,639 | $618,716 | $166,778 | $451,938 |
| 2015 | $6,146 | $589,253 | $158,836 | $430,417 |
| 2014 | $5,853 | $561,194 | $151,273 | $409,921 |
Source: Public Records
Map
Nearby Homes
- 100 E Custis Ave
- 2100 Mount Vernon Ave
- 5A E Custis Ave
- 1908 Mount Vernon Ave
- 1 E Custis Ave
- 6 W Mount Ida Ave
- 1800 Mount Vernon Ave Unit 207
- 216 E Duncan Ave
- 1706 Dewitt Ave Unit A
- 1700 Dewitt Ave
- 297 E Raymond Ave
- 2605 Fall Line St
- 317 Calvert Ave
- 313 Calvert Ave
- 508 E Custis Ave Unit A
- Huntly Plan at Del Ray Corner At Oakville
- Bryce Plan at Del Ray Corner At Oakville
- Flynn Plan at Del Ray Corner At Oakville
- 6 E Mason Ave
- 16 E Monroe Ave
- 2210 Mt Vernon Ave
- 2214 Mount Vernon Ave
- 2210 Mount Vernon Ave
- 2216 Mount Vernon Ave
- 2204 Mount Vernon Ave
- 2202 Mount Vernon Ave
- 113 E Del Ray Ave
- 111 E Del Ray Ave
- 2208 Mount Vernon Ave
- 2200 Mount Vernon Ave
- 2205 Mount Vernon Ave
- 2206 Mount Vernon Ave
- 2312 Mt Vernon Ave Unit SUITE 203, 202
- 2312 Mt Vernon Ave
- 2312 Mt Vernon Ave Unit 201
- 2312 Mt Vernon Ave Unit 202/204
- 2312 Mt Vernon Ave Unit SUITE 206-208
- 2312 Mt Vernon Ave Unit SUITE 207
- 2207 Mount Vernon Ave
- 118 E Del Ray Ave Unit SUITE 2/3