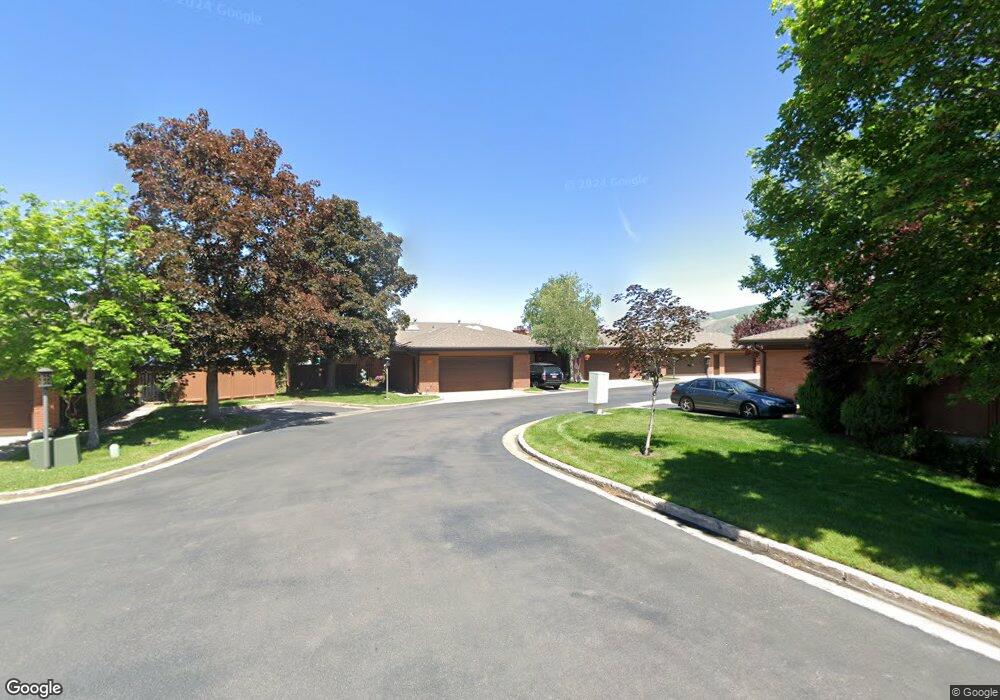
2212 Ridgewood Way Bountiful, UT 84010
Estimated Value: $602,000 - $664,000
5
Beds
3
Baths
3,250
Sq Ft
$193/Sq Ft
Est. Value
About This Home
This home is located at 2212 Ridgewood Way, Bountiful, UT 84010 and is currently estimated at $628,846, approximately $193 per square foot. 2212 Ridgewood Way is a home located in Davis County with nearby schools including Valley View School, Mueller Park Junior High School, and Bountiful High School.
Ownership History
Date
Name
Owned For
Owner Type
Purchase Details
Closed on
Nov 19, 2025
Sold by
Fuller Shy B and Fuller Todd E
Bought by
Fuller Todd
Current Estimated Value
Home Financials for this Owner
Home Financials are based on the most recent Mortgage that was taken out on this home.
Original Mortgage
$475,000
Outstanding Balance
$473,654
Interest Rate
6.3%
Mortgage Type
New Conventional
Estimated Equity
$155,192
Purchase Details
Closed on
Apr 9, 2019
Sold by
G Norman Christensen Trust
Bought by
Fuller Todd E and Fuller Shy B
Home Financials for this Owner
Home Financials are based on the most recent Mortgage that was taken out on this home.
Original Mortgage
$315,000
Interest Rate
4.3%
Mortgage Type
New Conventional
Purchase Details
Closed on
Jun 29, 2000
Sold by
Christensen G Norman and Christensen Judith W
Bought by
Christensen G Norman and G Norman Christensen Trust
Purchase Details
Closed on
Dec 18, 1998
Sold by
Lind Jenny
Bought by
Christensen G Norman and Christensen Judith W
Home Financials for this Owner
Home Financials are based on the most recent Mortgage that was taken out on this home.
Original Mortgage
$169,600
Interest Rate
6.86%
Mortgage Type
Purchase Money Mortgage
Purchase Details
Closed on
Aug 14, 1996
Sold by
Winters Jenny Lind
Bought by
Lind Jenny
Create a Home Valuation Report for This Property
The Home Valuation Report is an in-depth analysis detailing your home's value as well as a comparison with similar homes in the area
Purchase History
| Date | Buyer | Sale Price | Title Company |
|---|---|---|---|
| Fuller Todd | -- | Us Title | |
| Fuller Todd E | -- | Backman Title Service | |
| Christensen G Norman | -- | -- | |
| Christensen G Norman | -- | -- | |
| Lind Jenny | -- | -- |
Source: Public Records
Mortgage History
| Date | Status | Borrower | Loan Amount |
|---|---|---|---|
| Open | Fuller Todd | $475,000 | |
| Previous Owner | Fuller Todd E | $315,000 | |
| Previous Owner | Christensen G Norman | $169,600 |
Source: Public Records
Tax History
| Year | Tax Paid | Tax Assessment Tax Assessment Total Assessment is a certain percentage of the fair market value that is determined by local assessors to be the total taxable value of land and additions on the property. | Land | Improvement |
|---|---|---|---|---|
| 2025 | $3,116 | $299,200 | $86,350 | $212,850 |
| 2024 | $3,120 | $305,250 | $62,150 | $243,100 |
| 2023 | $3,122 | $554,000 | $113,000 | $441,000 |
| 2022 | $3,288 | $320,100 | $57,200 | $262,900 |
| 2021 | $3,139 | $468,000 | $86,000 | $382,000 |
| 2020 | $2,776 | $417,000 | $78,300 | $338,700 |
| 2019 | $2,629 | $385,000 | $74,000 | $311,000 |
| 2018 | $2,457 | $355,000 | $74,000 | $281,000 |
| 2016 | $2,238 | $175,450 | $30,800 | $144,650 |
| 2015 | $2,098 | $155,155 | $30,800 | $124,355 |
| 2014 | $2,011 | $152,340 | $18,333 | $134,007 |
| 2013 | -- | $125,474 | $17,600 | $107,874 |
Source: Public Records
Map
Nearby Homes
- 1987 Mapleview Dr
- 0 Bountiful Blvd
- 1475 Mueller Park Rd
- 1888 S 1150 E
- 1785 1450 E Unit 604
- 994 Deborah Dr
- 1087 Arlington Way
- 1735 S Temple Ct Unit 203
- 1596 E Millbrook Way
- 842 E 2150 S
- 1742 E Ridge Point Dr
- 1878 E Ridge Point Dr
- 1676 E Mueller Park Rd
- 2091 Windsor Park Cir
- 3252 Sunset Hollow Dr
- 631 E 1700 S
- 795 Abby Ln Unit 5
- 1886 S Jeri Dr
- 861 E Millbrook Way
- 2053 S 350 E Unit 7
- 2212 Ridgewood Way Unit 55
- 2224 Ridgewood Way
- 2224 S Ridgewood Way
- 2190 Ridgewood Way
- 2184 Ridgewood Way
- 2236 Ridgewood Way
- 2180 Ridgewood Way
- 2248 Ridgewood Way Unit 58
- 2285 Ridgewood Way
- 2269 Ridgewood Way Unit 44
- 2248 Ridgewood Way
- 2176 Ridgewood Way
- 2251 Ridgewood Way
- 2233 Ridgewood Way
- 2260 Ridgewood Way
- 2217 Ridgewood Way
- 2217 Ridgewood Way Unit 41
- 2170 Ridgewood Way
- 2170 Ridgewood Way Unit 50
- 2166 Ridgewood Way
Your Personal Tour Guide
Ask me questions while you tour the home.